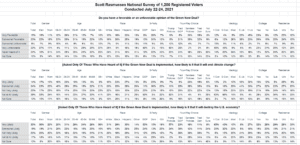
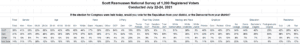
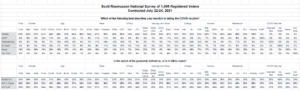
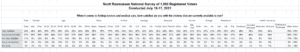
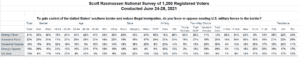
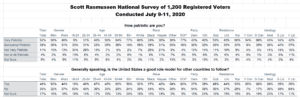
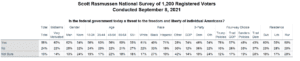
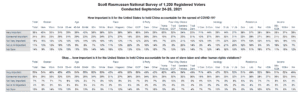
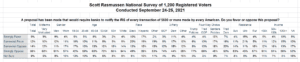
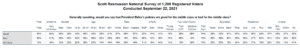
| Scott Rasmussen National Survey of 1,200 Registered Voters |
| Conducted July 29-31, 2021 |
|
| OPEN END RESPONSES |
| [asked of those who have been vaccinated] What are your thoughts about people who have not yet been vaccinated? |
|
| #GetVaccinated. |
| A reality we have to adjust to |
| America is a free country we each have our own choice |
| anger |
| As soon as possible take this vaccine |
| As soon as possible they should take vaccines |
| Aside from those who medically are not able to get vaccinated, I think it’s the responsible choice for people to get vaccinated so we can achieve herd immunity and stop this pandemic from needlessly hurting and killing people. |
| Ask again when FDA fully approves |
| Be safe |
| Be safe out here |
| Befuddled |
| better get it done soon |
| careless |
| careless and stupid at this point |
| Complete idiots. Most of them think its some sort of conspiracy. Other think something in it. just dumb people |
| Confused |
| Confused, irritated, frustrated with them. I think they’re easily manipulated and not very logical-minded. |
| Consider all |
| Crazy 🤪 stupid 🙄 |
| Crazy. |
| dangerously living |
| Death wish |
| Different people have different belief to make things back to normal I support them to get vaccinated |
| Disdain |
| do not fill they care for thereselves or other peope |
| Do not mandate! |
| don’/t understand them why not take vacine |
| Don’t care |
| Don’t like it |
| dont rly care its there body |
| don’t want to be around them |
| Dumb |
| Dumb |
| Dumb |
| Dumb asses |
| Dump |
| Even though they don’t prevent in virus 100%, being vaccinated is just another layer of protection. |
| Everyone has their thought but yes I think they should get the shot save there life |
| Everyone has there own choice to being vaccinated. But I think everyone should at least still wear a mask |
| Everyone makes there own decisions |
| Everyone need to vaccine. Don’t forget this vaccine |
| everyone should be vaccinated |
| Everyone should get vaccinated |
| Extremely mad and disgusted |
| Fear….Following wrong leader |
| Feel it unfair. |
| First i scared to take vaccine but my family members insist me to take it |
| foolish |
| Foolish |
| Fools! |
| For some, I do understand the mistrust for doctors and why that’s the reason they’re not getting it, however for those who arent getting it simply because they dont believe in the virus or because they think they’ll get “microchipped” are stupid and selfish and need to get vaccinated if we want to minimize this virus. |
| Free Choice |
| Free country |
| Freedom of right |
| Get it asap and for your kids |
| Get it done. |
| Get it please |
| Get the vaccine be safe for yourself and others |
| Good luck to em |
| Hard to understand why they are bringing country down |
| Hey girl I just don’t wanna wanna |
| Hope they don’t get sick n die |
| Hopefully they won’t get or spread the virus |
| I believe it is their choice. |
| I believe that they are very foolish and a danger to others |
| I blame them for the current surge |
| I can understand |
| I definitely recommend getting the vaccine because COVID-19 is a monster |
| I do believe it is every persons choice |
| I do not have a problem with them not getting the shot. |
| I do not have any thoughts about them |
| I do not know if they are scared or what but this pandamic will not get any better until everyone who can get vaccinated. |
| I don’t care about their thoughts about it I just know I’m getting superpowers or a free ticket to heaven |
| I don’t understand why someone would take a chance with their precious life. |
| I don’t agree with them, but if I know who they are, I will definitely stay away from them. |
| i dont care about others |
| I don’t Know |
| I don’t think it’s safe. As of this morning 99% of those dying in hospitals from Covid are unvaccinated. |
| I dont think they are doing good for the economy. |
| I don’t understand it. They could die. |
| I don’t understand what they are waiting for |
| i don’t understand why you would not want to be safe or help the other people |
| I feel it’s a person’s right to choose but if they aren’t getting vaccinated they should have to where masks everywhere they go. I don’t think the vaccinated should have to where masks we did the right thing and shouldn’t be punished. |
| I feel its their choice |
| I feel like it is their own choice but that is a very small sacrifice to keep everyone safe & put an end to this virus . |
| I feel like they are misinformed |
| I feel that maybe they reasons why they dont want it and people should respect |
| I feel their actions are selfish and irresponsible. |
| I feel they not safety |
| I have no opinion |
| I have no opinion on people who have not been vaccinated . It is their own rights to get the vaccine. |
| I have no problem with them I just want them to make sure they wear their mask it is really dangerous not to wear it because I don’t want them getting Covid and spreading it |
| I have no thoughts at this time, about other people thoughts. |
| I have no thoughts on the people who haven’t been vaccinated. I wouldn’t be vaccinated if I didn’t feel pressured to be |
| I have nothing nice to say about these people |
| I hope they die before they get me killed. |
| I know it s theyr business but they should not go outside and endangered other |
| I know it was just fine and you know it’s good and I think that vaccines next |
| I pray they don’t become ill. |
| I really font know why Rhee not getting it they should make it mandototy |
| I respect the decision |
| I say it’s ur life but look around and see how it’s affecting others |
| I say they are being selfish af |
| I slightly understand their hesitation because it came out so quickly, but strongly believe they should be willing to mask up if they aren’t willing to be vaccinated. I also think they’re the result of consistent misinformation about the virus and the vaccine from whatever news sources they consume |
| I think all of people should have take covid vaccine for being healthy. |
| I think any person who doesn’t get the vaccine is misguided. The vaccine does nothing but help. |
| I think anyone who isn’t vaccinated is doing a great deal of harm to this country. I think if an outbreak happens and it can be traced back to someone who isn’t vaccinated that person should face legal consequences. |
| I think every people should take thik quickly |
| I think everyone should be vaccinated to ensure safety for all. |
| I think for the benefit of themselves and others they should be vaccinated |
| I think it is a personal decision but for those who choose not to get vaccinated are risking there life’s as well as kids and other who are compromised. Getting all your information from chosen network or social media can strongly influence the less educated on the topic. |
| I think it is a selfish response to a worldwide pandemic. |
| I think it’s a choice |
| I think its extremely selfish. That issue its what causing things like the delta variant |
| I think it’s somewhat irresponsible |
| I think it’s their decision |
| I think its there choice if they wan it or not |
| I think people are just truly scared of the side effects |
| i think that there just not thinking or they cant get it |
| I think that they are being foolish |
| I think that they are causing a lot of problems so that the country can’t be safe from covid. We eradicated polio but too many won’t be vaccinated because the government is not correct in the vaccine helping. It isn’t FDA approved, changes your DNA are just a few that prevent many from getting it. The government is trying to control us. So I feel they don’t understand the problem. |
| I think the people need to get vaccinated |
| I think their total assholes. Sorry for the cuss word. They just don’t care about anybody. It’s because of them that this new surge is going on! |
| I think they are at risk |
| I think they are being selfish and are part of Cult 45. |
| I think they are dumb |
| I think they are either stupid or selfish. |
| I think they are endangering people. |
| I think they are foolish and putting those of us who are vaccinated at risk. |
| I think they are foolish. |
| I think they are foolish/stupid/selfish and are putting even those who are vaccinated at risk. |
| I think they are not very smart, but I also think enough of them will die that our population will be smarter for it. |
| i think they are safe |
| I think they are scared but at the same time there decision not to vaccinate is not good for the country |
| I THINK THEY ARE SELFISH,DUMB |
| I think they are thoughtless people who don’t care about our society as a whole or anyone except themselves |
| I think they are very inconsiderate to others who are compromised |
| I think they are very irresponsible and very selfish. Millions of people have already been vaccinated and are fine their excuses for not wanting to get vaccinated are not even valid. |
| I think they are wrong and doing a worse to the people of our country |
| i think they bare crazy not protect them self |
| I think they cause a danger to people are still vaccinated because you can still get sick |
| I think they ought to do that quickly because it is a big problem |
| I think they should vaccinated soon |
| I think they should be able to do what they want, the vaccine does not do anything to them, it’s a waste of time. |
| I think they should be vaccinated before beenig aloud any money From the government or state’s |
| I think they should get it because it will stop this virus. |
| I think they should get it. It will help if they contract the virus |
| I think they should get vaccinated but at the same time you can’t force someone to get vaccinated when they don’t want to |
| I think they should get vaccinated by choice |
| I think they should get vaccinated when they want but please wear a mask and social distance |
| I think they should get vaccinated, but I do think it is their choice and the government shouldn’t mandate or pressure them. |
| I think they should take the advantage hat other people in other countries don’t have the opportunity to receive the vaccines |
| I think they’re extremely selfish, and should respect others feelings about getting this disease. |
| I think they’re being selfish |
| i thought nothing just glad my famiy is. |
| I understand the fear of the unknown since the vaccine was mass produced with no testing but it is helping to save lives so I believe it should be taken. |
| i understand their hesitation |
| I understand their worries but it’s what’s best. |
| I understand there rights but they are not thinking about anyone but themselves |
| I understand why they might be hesitant. |
| I understand you might be hesitant but everyone need to take it |
| I understand. Their views on side effects |
| I want them to get vaccinated to protect themelf. |
| I wanted that they are fastly take a vaccien. |
| I wish them all the best, however they still need to wear mask and protect themselves and others |
| I wish they would |
| I wish they would get vaccinated |
| I wish they would get vaccinated but no one can make them |
| I wish they would get vaccinated. We will reach herd immunity much faster if everyone gets vaccinated. |
| I wish they would take the vaccine for the good of the country if not for themselves. |
| I work in the medical field so I see everyday how its affecting our state |
| I worry about them |
| I would prefer that everyone be vaccinated but I respect everyone’s right to choose. |
| I would recommend giving the vaccine |
| I’d rather they got vaccinated, but it’s their choice. |
| I’d rather have suffer from some side effects from vaccine then be put in the hospital |
| I’d rather suffer the side effects of a vaccine than the hospitalized with the virus |
| Idiots |
| Idiots |
| Idiots |
| idiots |
| idiots and should die |
| Idiots with no regard to their fellow man |
| Idiots! |
| If it’s by choice, then they aren’t doing their part. |
| If there’s no legitimate reason for them not to be vaccinated (lack of resources/access, no method of transportation, medical issues that would get in the way), not being vaccinated is a selfish, dangerous public health risk. There’s no excuse unless you have actual, concrete reasons why you can’t yet get vaccinated. |
| If they are able but unwilling, then they are selfish and stupid at this point. |
| If they are allergic to it, they shouldn’t get the vaccine. But if they aren’t, they should get it |
| If they cared about other people they would get it. |
| If they do not have a legitimate medical reason for being unvaccinated, they are being stupid and very selfish. They need to stop watching Fox News, Newsmax, OAN, etc. and stop reading false information on social media. |
| If they don’t want to vaccinate that is fine but government and some private organizations and companies may require it. |
| If they get covid hospitals should let them die. Unless they’re immunicomproswd amd can’t get the vaccine because of that or under age anyone who doesn’t and gets covid gets no sympathy from me die for all I care let evolution get rid of stupid ones |
| Ignorant |
| Ignorant |
| Ignorant |
| Ignorant |
| Ignorant Idiots Ripe for Darwinian Justice |
| Ill informed |
| I’m angry that they refuse to be vaccinated. Former president Trump politicized the pandemic and it’s killing Republicans. Social media spreads disinformation about vaccines and those who have not been vaccinated lack basic scientific literacy and are susceptible to political propaganda. |
| I’m sad that they’re so scared and/or misinformed that they’re putting the whole country at risk by not being vaccinated yet. I’m angry that they’re causing unnecessary death and suffering. |
| Imbeciles |
| Important democratic |
| in all honesty they are complete idiots in denial. |
| In my opinion, I want everyone vaccinated as soon as possible |
| Indifferent |
| IRRESPONSIBLE |
| Irresponsible |
| Irresponsible |
| Irresponsible and irrational |
| Is there choice but as much as possible i want them to be vaccinated |
| It angers me because they are creating new variants & spreading it. |
| It depends on their personal circumstances but everyone who can get vaccinated should |
| It doesn’t really offend me |
| It is a personal choice. I don’t know if there is a right or wrong decision. I was concerned about getting vaccinated and wasn’t sure I wanted it. I’m still not 100% sure it was the right thing to do for my body |
| It is a societal obligation to be vaccinated |
| It is completely their choice. If they don’t want to be, I’m fine with that. |
| It is ok |
| It is okay |
| It is safe and protect from effect of covid |
| it is so good and nice tho |
| It is their bad choice |
| it is their choice |
| it is their choice |
| It is their choice |
| It is their choice |
| It is their choice |
| It is their choice but it is not a wise one. |
| it is their choice but they are putting themselves at risk and others |
| it is their choice not mine |
| It is their choice, but I would recommend they get vaccinated to protect themselves and others |
| it is their choice, that is what freedom is all about |
| It is their choice. We still live in a free country |
| It is their choice. I am not angry at them. I am not afraid of them. |
| It is their choice. That’s what America is about |
| It is their decision. |
| It is their own choice. You can’t pressure someone to do something they don’t want to do. It is their right to refuse |
| It is their personal choice |
| It is their personal decision |
| it is their right to choose, but not a smart decision, unless they have underlying circumstances that would masks the risks outweigh the benefits. |
| It is their right to determine whether they want to be vaccinated or not. |
| It is there right not to be vaccinated but we will continue to have restrictions and this pandemic will go on forever |
| It is there right to choose |
| It is up to each individual if they want the shot or not. |
| It makes me angry because COVID cases have spiked and it’s making this pandemic last longer. If you’re healthy and able you should get vaccinated. Period. |
| It saves lives |
| It should be mandated/required |
| It should be mandatory for all people who are in the US ! Like treasonous Donny wanted to do with the people who tested positive send them to Guantánamo Bay ! Amen |
| It their personal choice |
| It there choice to take it or out my opinion does matter neither way |
| It would depend on why they haven’t been vaccinated |
| It’s a personal choice but even if you have or haven’t been vaccinated you still need to stay safe and take protective measures against covid |
| It’s a personal choice but I think they should get the vaccine. |
| It’s everyone’s own choice but eventually it may be required for certain things. |
| It’s everyone’s own choose to be vaccinated or not so I don’t have an opinion. |
| It’s good |
| It’s important for both them and others to make this world a better place |
| It’s irresponsible |
| It’s their body their choice. |
| It’s their choice |
| It’s their choice |
| It’s their choice |
| It’s their choice just don’t bug me about being vaccinated or my wearing a mask |
| It’s their choice to do so and they assume the risks of it. However if them getting sick causes things to shutdown again, then there’s a problem |
| It’s their choice to take it or not. |
| It’s their choice, but I hope they do. |
| It’s their choice, but then they need to wear a mask EVERYWHERE in public unless they are at least 6ft apart from ANYONE. |
| It’s there choice |
| It’s very important that you should. |
| It’s very worried about that. |
| Its a good thing to do to help keep others from getting sick. |
| It’s a personal choice |
| It’s a personal choice. I would advise getting vaccianted by its each individuals own deicision |
| its one way to protect covid 19 |
| Its safe for them being around other people |
| its their choice |
| its their choice |
| Its their choice |
| its their choice |
| It’s their choice |
| It’s their choice |
| It’s their choice |
| It’s their choice |
| It’s their choice but some people have reasons that are conspiracy theories that doesn’t make much sense |
| It’s their choice, but a dangerous one. |
| It’s their choice. |
| It’s their choice. No one should be forced to do something they don’t want to |
| It’s their choice. Not mine. If they want it they can get it. If they don’t want it, then that’s fine too. None of my business. |
| It’s their decision, but they have issues with the evaluation of the risk |
| It’s their decision. |
| It’s their funeral |
| It’s their life |
| It’s their own choice |
| It’s their own choice if they want to be vaccinated and I respect their opinions. However, they should understand their risks. |
| It’s their own personal choice whether to do so or not. At the same time the more people that go unvaccinated the longer the pandemic is going to not end completely. |
| It’s their own right |
| Its their right |
| Its there choice |
| It’s there choice |
| It’s there choice as a free American, but I would hope more think about getting the vaccine. |
| It’s up to them |
| It’s up to them |
| It’s up to them. |
| It’s up to them. I think everyone should get the vaccine unless they are allergic to it. |
| Just like voting do your civic duty and get vaccinated please |
| just waiting for the results of others |
| Keep my distance from them and doing my best not to get Covid-19 |
| Lack common good |
| Lack of knowledge or listen to their peers |
| Let them get vaccinated and help us |
| Let them go. |
| majority are doing it for the wring reasons |
| Making it difficult to go outside more. |
| Making them feel safe and ensuring them that the vaccine they choose is safe |
| Maybe they’re afraid to get the shot |
| Misguided |
| Misinformed |
| Mixed |
| Moronic |
| Most have bought into the anti-vaxxer rhetoric or the Trump rhetoric of fear that their rights are being taken away or worse. They are jeopardizing the people who truly cannot get the vaccine. They care only for themselves. |
| Most likely get sick or die. |
| Most of them wants to get vaccinated but vaccines are not enough |
| Must get vaccin |
| My thoughts about people who have not yet been vaccinated are that they are a threat the health of the country and their loved ones around me |
| My thoughts about the people who have not been Vaccinated is crazy and they are putting their lives& loves in And I strongly emphasize emphasize that they all go and get Vaccinated soon as possible |
| My thoughts is that I believe they were somehow scared of the consequences |
| My thoughts on people who have not been vaccinated is that they may not have access to the vaccine and some people still are questioning the mass production as quickly as it was. |
| N/a |
| Need to be vaccine let’s them know it not going to change your DNA in writing letters to help with the vaccine shots show them it safe |
| Need to take care their health |
| need to take it soon |
| Negative |
| Negative |
| Neither here nor there. Its there right to approve or decline getting it. |
| No comments |
| No idea |
| No opinion either way- it’s a personal choice |
| No thoughts |
| No thoughts can’t speak for anyone |
| None |
| None |
| None |
| None |
| None ít everyone choice |
| None, I went a while myself b4 getting tha vac, but regardless I feel we still should practice social distancing and limit being out where it can potentially be over crowed |
| Non-vaccinated people endanger their community and humans worldwide |
| Not concerned about fellow man. |
| Not good |
| Not safe |
| NOT SURE |
| not sure, it is there right, cdc and congress should have investagated the WUHAN lab in China, but instead spent millions of dollars on bogus impeachment hearings |
| Not taking the virus seriously |
| not very smart |
| Not worried |
| Nothing |
| own choice |
| People in danger |
| People make their own decisions about their bodies and their health. |
| People should take vaccine |
| people who didn’t get vaccinated they should vaccinate as soon as possible.Because this virus is really very dengerous as we can see. |
| People who have not been vaccinated think it’s a control issue |
| People who have the opportunity to get vaccinated yet don’t are being selfish. They don’t care about lives outside of theirs that could be endangered. |
| People who refuse to get vaccinated is being selfish |
| Person choice |
| Personal choice with a relative unknown |
| Playing with fire |
| please just do it |
| Poor choice impacting others |
| Probably need to be |
| Problematic |
| Procrastinators |
| Pure stupidity |
| Put down the ciggy and beer, get your ass off the couch, and get vaccinated. Otherwise, go somewhere crowded, catch COVID, and die you worthless paranoid POS. |
| Putting themselves in danger |
| Religious beliefs |
| Reserve judgement about why, just get them vaccinated ASAP. |
| Ridiculous. We cant get back to normal unless we get everyone safe. Lies and conspiracies are rampant and getting way out of control |
| Risky |
| rural people |
| Sad |
| Sad for them |
| Sad, hope they will do it |
| Saving my family because family everything |
| Science is real, people learn the hard way. |
| Self centered |
| Selfish |
| Selfish |
| Selfish |
| selfish |
| Selfish |
| selfish |
| Selfish and in denial. |
| Selfish and letting putting politics above the health of the country |
| Selfish and uneducated |
| Selfish don’t care about their fellow man |
| selfish people thinking of them selves |
| Selfish people who don’t care that they have allowed this virus to mutate into a more dangerous form, and put everyone at greater risk. They should not be allowed to participate in society or send their children to school. |
| Selfish!! |
| Selfish, ignorant |
| Selfish, inconsiderate and making a vaccine political instead of life saving |
| Shameful, selfish, dumb |
| Should be a personal choice. |
| Silly. |
| Since it is a viral disease,we should all be vaccinated to stay healthy to avoid this epidemic. |
| Some else’s personal choice is not my concern |
| Some may have medical or religious reasons but most are just considerate of others |
| Some may have specific medical reasons. Most are stubbornly misinformed angry zealots |
| Some may have valid reason, I pray for those that believe it is in any way dangerous |
| Stay away from them |
| Stay far away from me |
| Stupid |
| Stupid |
| Stupid |
| Stupid |
| Stupid jerks |
| Stupid selfish |
| Stupid. |
| Sudden death |
| T |
| Taking a big risk |
| That is their right |
| That people don’t are irresponsible |
| That they are being stupid. We all need to get it to keep it under control |
| That was some reason |
| That’s they choice |
| That’s on them |
| That’s their problem |
| that’s their right, it is called Freedom! |
| the are lazy |
| The first time he was in a t |
| The government should continue to pay medical costs for vaccinated people but unvaccinated should be on their own and be responsible for these bills. |
| The ones who choose not to are part of the reason the virus is mutating and Covid cases are rising. I’m frustrated! |
| The people who have not taken a vaccine or in grave danger. Everyone needs to get the shot. |
| The unvaccinated are the reason that we have the Delta very end and it’s taking more lives in the United States today people that are unvaccinated are uneducated and they should not be allowed to be out where those that are vaccinated are |
| Their body, their choice |
| Their body, their choice |
| Their body, their choice. Vaccine was rushed to production and may have side effects or unknown consequences |
| Their business |
| Their business. |
| Their choice |
| Their choice |
| their choice |
| their choice |
| Their choice |
| Their choice |
| Their choice |
| Their choice |
| Their choice |
| Their choice but probably not logical |
| Their choice, but I wish they would consider others who cannot stave off an infection. |
| Their choice. |
| Their choice. I don’t have a say. |
| Their Choice. Since there have been no long term studies and this is not FDA approved I understand those that don’t get vaccinated |
| their choose |
| there choice no one should make them if they do not want to |
| There is no excuse not to be vaccinated if you are over 12 years old. |
| There need to |
| They afraid of long term consequences |
| They are a problem. |
| They are afraid |
| They are at higher risk in catching the virus compared to those who did. |
| They are back dated |
| They are being extremely selfish |
| They are being selfish by not protecting themselves and others |
| They are believing something that is not true. Stupid stupid people |
| They are bold |
| They are cautious and smart. Not enough is known about lasting effects |
| They are crazy |
| they are dangerous |
| They are dragging out the end of this pandemic and have become part of the problem. |
| They are dumb as hell |
| They are dumb the vaccine is the only thing that can save us |
| They are dumb. The government should mandate and make everyone get at least 1 dose of the shot. |
| They are endangering other people’s lives. |
| They are evil and keeping the pandemic going. Murderers. |
| They are fools and deserve whatever they get |
| THEY ARE FOOLS AND UNAMERICAN, SELFISH |
| They are future candidates for Darwin Awards. |
| They are giving the virus time to mutate into something worse. Children and immune-compromised adults can’t be vaccinated. In order to protect them through herd immunity, all elligible adults have a moral obligation to be vaccinated. The anti-vaxers are deluded and live in some kind of alternate reality. |
| They are helping spread covid more and more |
| They are idiots |
| they are idiots and are exasperating the covid problem |
| They are Idiots unless doctor says no due to health reasons |
| They are idiots who are going to cause another wave. |
| They are ignorant |
| They are ignorant |
| They are in danger.They should get vaccinated as soon as possible. |
| They are irresponsible |
| They are irresponsible and ignorant of reality. They will hurt themselves and others for no reason |
| They are irresponsible and ignoring science, unless they have a legitimate medical condition that prevents them from getting vaccinated. Vaccines are safe and important and about more than just yourself. |
| They are irresponsible cowards if they don’t have a legitimate medical reason for not being vaccinated yet |
| they are just stupid |
| They are just stupid and crazy |
| they are letting this virus spread by being uninformed about the vaccine. |
| They are making a very poor choice and are having a negative impact Jon all of us |
| They are making it bad for everyone, they are brainwashed. If they get covid they should NOT take up our hospital resources, they should be left to fend for themselves. There is NO reason the whole planet should not be vaccinated |
| They are making the pandemic last longer and hurting everyone else including themselves. |
| They are misinformed and selfish people. |
| They are misinformed. It has become a political identity and group identity than really based in any type of science. I think its directly been fueled by politicians muddying the water and Facebook misinformation. |
| They are more at risk |
| They are narcissistic, selfish, and ignorant. |
| They are not doing anything to upset Trump. |
| They are not very smart |
| They are not worried about infecting other people. |
| They are patiently waiting for it |
| They are playing with fire |
| THEY ARE PLAYING WITH THEIR LIVES |
| They are playing with there lives |
| They are potentially signing their death warrant, but it is their right to do so. |
| they are pretty cool |
| They are putting others at risk. |
| They are putting others at risk. We may have to be shut down again. I would be very upset. I am wanting to travel. |
| They are putting the rest of us at risk |
| They are putting themselves and others in danger |
| They are putting themselves in danger and others |
| They are responsible for the spread of the Delta Variant |
| They are risking their lives and the lives of others. It’s disrespectful to healthcare workers who have already been through hell… |
| They are risking their lives and the lives of others. This dx is serious and deadly. GET Vaccinated asap! |
| They are scares |
| They are self-centered . |
| They are selfish |
| They are selfish |
| They are selfish and stupid |
| They are selfish and very stupid |
| They are smart- I was vaccinated and i caught COVID- no reason for vaccination- we need herd immunity- it will always be here like the flu- tike to move on |
| They are stupid |
| they are stupid |
| They are stupid an killing people |
| They are the reason that this virus will never get under control |
| They are thoughtless and selfish |
| They are un-American. |
| They better do it now |
| they can be easily sick and very easy to get a covid |
| They can not possibly understand the science. It is in their best interest and the best interest of the people they love to be vaccinated. I honestly don’t understand the hesitation at this point. It has been a year of death, of refrigerated trucks holding the overflow of corpses…honestly. Whats it gonna take? |
| They can still get sick and cause danger to the people around them |
| They do not care if they catch the virus. |
| They do not understand, that the Virus is real |
| They don’t know how to read research, gullible and easily believe misinformation |
| They don’t understand immunology or how to keep a general population safer. They’re selfish and believe that they can stay safe when they’re proven wrong over and over. |
| They don’t care about others or themselves and don’t care to die |
| they dont know about there facielites |
| They don’t think |
| They dont want to or are afraid to |
| they had their chance. let them die. |
| They have a right to choose |
| They have legitimate health concerns about the vaccine especially with people getting sick and/or dying. |
| They have the right to choose |
| They have the right to their own health |
| They have their own opinions of the vaccine |
| They have their own rights. |
| They have their reasons but hopefully they will do what is best |
| They have to be careful , the virus is real and is really fatal |
| They have to be vaccinated |
| they have very stupid reasons and explanations |
| They have weird conspiracies |
| They may be unwilling to be vaccinated or they don’t have the means to get vaccinated. |
| they must be vaccinated |
| They need more education about the vaccine |
| They need more information and I pray they stay healthy |
| They need to |
| they need to be and quick |
| They need to be vaccinated to avoid the spread |
| they need to do it — if not for themselves for everyone else |
| They need to do the right thing and get vaccinated. |
| They need to get and stop being stupid. |
| They need to get it done |
| They need to get the vaccine as soon as possible |
| They need to get vaccinated |
| They need to get vaccinated |
| They need to get vaccinated |
| They need to get vaccinated so they won’t get sick or even die. |
| they need to get with the program |
| They need to go ahead and get vaccinated. |
| They need to hurry up and get vaccinated if they can |
| They need to make informed decisions for themselves, not bow to pressure, there are other options and measures that can be taken |
| they need to step up and get the shot |
| They need to think about other people around them |
| they need to wake up and get vaccinated |
| They need to wear masks and not be allowed to do things like enter theme parks ect until they get vaccinated |
| They probably should get it but the government has no right to force them |
| they provide best service in short period of time |
| They really need to get |
| They really should just so we can slow down the progression of the virus |
| they really upset me because we could control it better if everyone would get vaccinated |
| they shoudl get vaccinated |
| They should |
| They should |
| They should and stop the spread of covid |
| They should be excluded from care in the ER if they test positive for covid and have severe symptoms. Let them die. |
| They should be forced to get the vaccine. |
| They should be quarantined |
| they should be vaccinated quickly |
| They should be vaccinated! |
| They should before more people die |
| They should but it is their choice |
| They should do it |
| They should get it at least to make sure they are ok and safe |
| They should get it for the other safeties of other people and themselves |
| They should get it. They are becoming variant factories. |
| They should get it….delta variant is highly contagious! |
| They should get the shot as soon as possible |
| They should get the vaccine already |
| They should get the vaccine. |
| They should get vaccinated |
| They should get vaccinated |
| They should get vaccinated |
| They should get vaccinated |
| They should get vaccinated |
| They should get vaccinated |
| They should get vaccinated |
| they should get vaccinated |
| They should get vaccinated |
| they should get vaccinated |
| They should get vaccinated as soon as possible |
| They should get vaccinated asap |
| They should get vaccinated immediately |
| They should get vaccinated so we can get back to normal |
| They should get vaccinated unless they have medical or religious reasons |
| They should get vaccinated. |
| They should get vacinated |
| They should go and get vaccinated before it too late |
| They should go do it |
| They should help everyone out and get it done |
| They should just do it |
| They should just get it already |
| They should so we could be protected from covid |
| they should stay at home |
| They should take it as soon as possible |
| They should take it quickly |
| They should take the vaccine right now |
| They should take their health seriously |
| They should try for themselves so that they can be able to know what works for them. |
| They should try to get it |
| They sucks for not being vaccinated |
| they were very bad people |
| They will die |
| They’re idiots and selfish. Just because they don’t want it doesn’t take away from the threat it could present to those with autoimmune deficiencies. |
| They’re idiots. You can’t fix stoopid. |
| They’re stupid |
| They’re being irrespsonsible. |
| They’re contributing to the spread |
| They’re covering for those who haven’t been vaccinated |
| They’re crazy |
| They’re hurting everyone else! |
| They’re ignorant ass people. |
| They’re keeping us from reaching herd immunity |
| They’re not smart and are selfish |
| They’re not very smart about it |
| They’re OK |
| They’re risking their lives and putting others in danger |
| They’re selfish |
| They’re Stupid or selfish |
| think they are not listening to science & are being self centered & irresponsible |
| thisis verry good andb best |
| Those are loosing excellent opportunities that is free and available. |
| Those people need to hurry up and get vaccinated |
| Those who are yet to be vaccinated are a great threat to themselves and those around them. |
| thy are risking their lives |
| Tickers have been arranged in front of them |
| To each his own. I would not ever allow myself to be subject to a Global Pandemic with symptoms that could cost me my life. |
| To each its own |
| To each their own |
| to each their own, stay inside then, |
| TRUMP SUPPORTER IS NOT YET BEEN VACCINATED. |
| TRUMP SUPPORTER IS NOT YET BEEN VACCINATED |
| Uneducated |
| Uneducated or not willing to admit they are wrong. |
| Uninformed or mental midgets |
| Unless they are unable to be vaccinated, they are idiots |
| Unless they have an actual medical reason not to, it’s everyone’s responsibility to get vaccinated to control the pandemic and get life back to normal. |
| Unsafe to be around |
| Up to them |
| vaccinated as soon as everybody. |
| Vaccinated is most important to us.It helps us fit. |
| vaccinated is very important for refuse Corona virus |
| Vaccination is very important |
| Very irresponsible and putting others at risk |
| Victims of a poor media.We need to bring back the FCC Fairness Doctrine. ASAP! Stop dividing! |
| Waiting on the right time |
| Waiting to see those vaccinated what kind of efficacy |
| Ware you mask |
| Whatever |
| who has evaluated that following vaccines |
| Wilfully ignorant and harmful to the common good. |
| Wish they would |
| Wish they would but it is their decision not the governments |
| Worries that will always to this who aren’t eligible |
| yall need to go get yall shot |
| yes no effects many peoples fake news |
| Your choice |


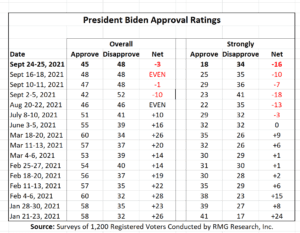


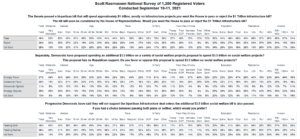
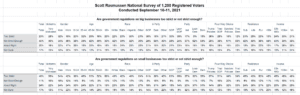


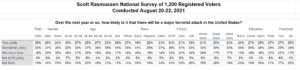
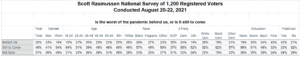
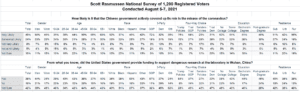
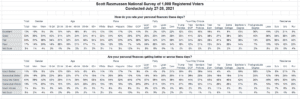
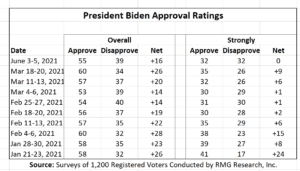
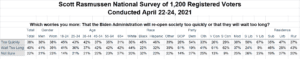
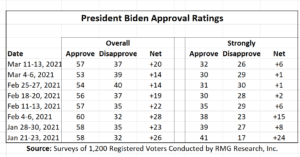
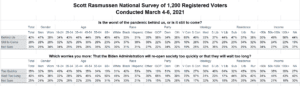
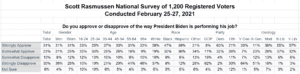
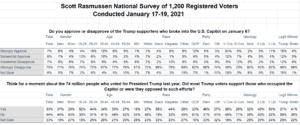
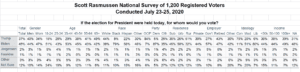
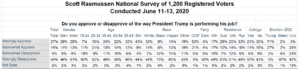
 taken recently by President Biden.
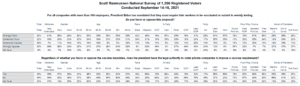
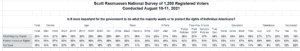
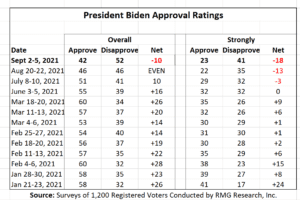
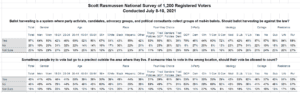
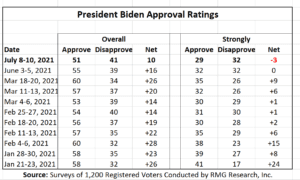
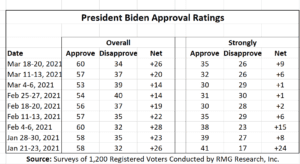
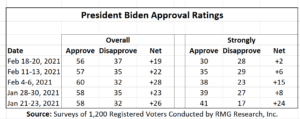
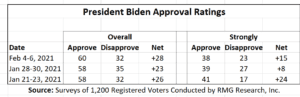
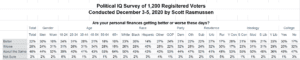
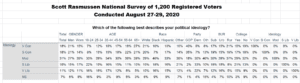
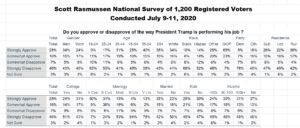
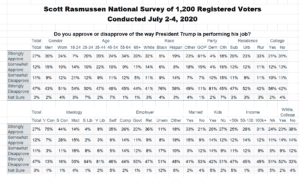
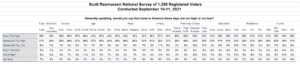
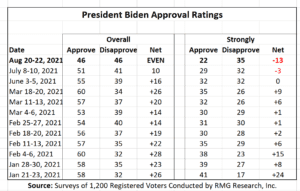 The current totals include 22% who Strongly Approve and 35% who Strongly Disapprove. That is by far the most negative assessments yet measured for the president.