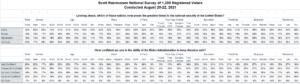
Forty-five percent (45%) of voters have at least some confidence in the ability of the Biden Administration to keep America safe. A Scott Rasmussen survey found that 48% do not.
Those totals include 20% who are Very Confident in the ability of the Biden team to keep us safe and 32% who are Not at All Confident.
Seventy-seven percent (77%) of Democrats express confidence in the Administration. That confidence is shared by 29% of Independent voters and 17% of Republicans.
The situation at the Southern border may be a factor in the general lack of confidence. Data released earlier showed that 58% of voters believe that drug cartels have more control of the Southern border than the U.S. government.
Just 28% of voters believe the federal government today is seriously trying to secure the border and reduce illegal immigration. There is a strong belief that many of those crossing the border illegally are drug dealers, human traffickers, and more.
When given a choice, 42% of all voters see China as a bigger threat than either Russia or Afghanistan. Of those three nations, 18% see Russia as the biggest threat while 16% point to Afghanistan. Following the chaotic withdrawal from Afghanistan, 49% of all voters believe that our enemies view us as weaker than before. Just 21% disagree.
Data released earlier showed that 59% think a major terrorist attack in the U.S. is somewhat or very likely within the next year.
SIGN UP to receive Scott’s free email newsletter.
CHECK OUT Scott’s latest polls.
Note: Neither Scott Rasmussen, ScottRasmussen.com, nor RMG Research, Inc. have any affiliation with Rasmussen Reports. While Scott Rasmussen founded that firm, he left more than seven years ago and has had no involvement since that time.
Methodology
The survey of 1,200 Registered Voters was conducted by Scott Rasmussen using a mixed mode approach from August 20-22, 2021. Field work for the survey was conducted by RMG Research, Inc. Most respondents were contacted online or via text while 215 were contacted using automated phone polling techniques. Online respondents were selected from a list of Registered Voters and through a process of Random Digital Engagement. Certain quotas were applied, and the sample was lightly weighted by geography, gender, age, race, education, internet usage, and political party to reasonably reflect the nation’s population of Registered Voters. Other variables were reviewed to ensure that the final sample is representative of that population.