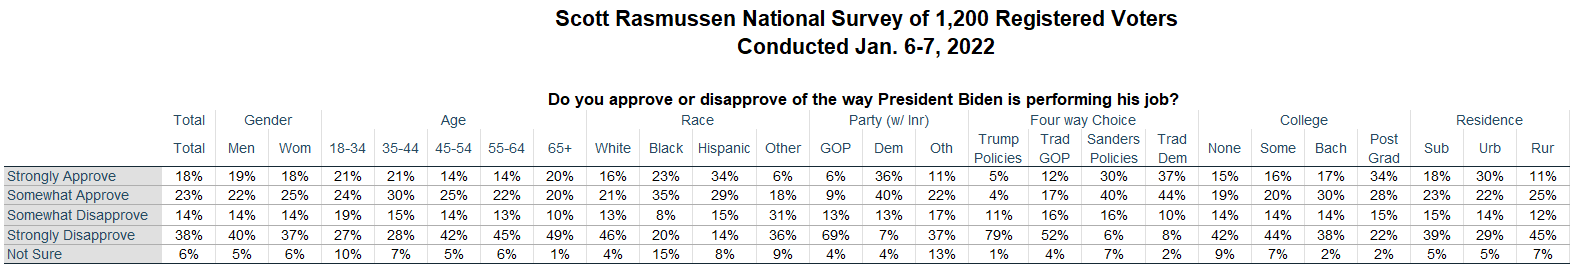
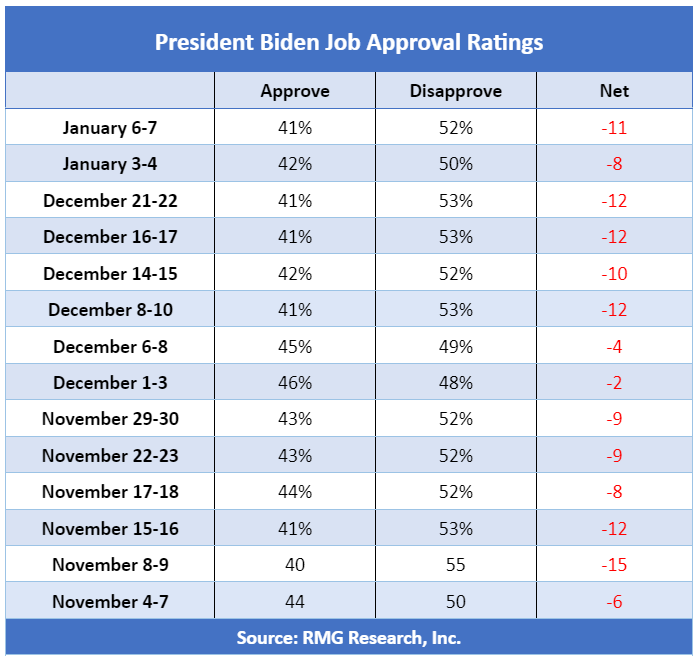
Forty-one percent (41%) of voters nationwide now approve of the way President Biden is performing his job. The latest Scott Rasmussen survey finds that 52% disapprove and 7% are not sure.
The current totals include 18% of voters who Strongly Approve of the president’s performance while 38% Strongly Disapprove.
Since December 8, six consecutive Scott Rasmussen national surveys have found the president’s Job Approval rating at either 41% or 42%.
Sixty-two percent (62%) of those with a college degree approve of the way the president is performing his job. A majority of all other voters disapprove.
Data released earlier showed that 62% of those with a postgraduate degree rate their own finances as good or excellent. A majority of all other voters say their finances are either fair or poor.
Overall, economic confidence has declined rapidly in recent months. That may be one reason that 57% of voters favor making the Trump tax cuts permanent.
Finally, just 13% of voters believe that U.S. trade policy should consider only economic issues. Seventy-five percent (75%) believe national security and human rights issues should also be considered.
SIGN UP to receive Scott’s free email newsletter.
CHECK OUT Scott’s latest polls.
Note: Neither Scott Rasmussen, ScottRasmussen.com, nor RMG Research, Inc. have any affiliation with Rasmussen Reports. While Scott Rasmussen founded that firm, he left nearly a decade ago and has had no involvement since that time.
Question:
Do you approve or disapprove of the way President Biden is performing his job?
18% Strongly approve
23% Somewhat approve
14% Somewhat disapprove
38% Strongly disapprove
6% Not sure
Methodology
The survey of 1,200 Registered Voters was conducted online by Scott Rasmussen on January 6-7, 2022. Field work for the survey was conducted by RMG Research, Inc. Certain quotas were applied, and the sample was lightly weighted by geography, gender, age, race, education, internet usage, and political party to reasonably reflect the nation’s population of Registered Voters. Other variables were reviewed to ensure that the final sample is representative of that population.
The margin of sampling error for the full sample is +/- 2.8 percentage points.