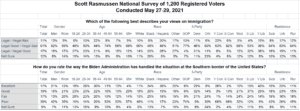
Thirty-six percent (36%) of voters give President Biden Good or Excellent marks for his handling of the situation at the Southern border of the United States. A Scott Rasmussen national survey found that 39% hold the opposite view and rate his performance as poor.
In between are 17% who rate the president’s performance as just fair.
Sixty-one percent (61%) of Democrats say the president is doing a good or an excellent job on the border. However that view is shared by just 22% of Independent voters and 12% of Republicans.
The survey also found that 61% believe illegal immigration is bad for the United States while also believing that legal immigration is good. That view is held by 77% of Republicans and 60% of Independents. Among Democrats, 46% share the mainstream view. However, 31% of those in the president’s party that both legal and illegal immigration are good for the nation.
Just 11% of all voters that legal immigration is bad for the U.S.
Other recent polling data found that 65% of voters believe the U.S. is friendlier towards immigrants than most other nations.
Seventy percent (70%) of voters view immigration and border control as a national security issue. Sixty percent (60%) of voters see the growing number of illegal immigrants to be an invasion of the United States. Fifty-eight percent (58%) of voters believe that drug cartels have more control of the Southern border than the U.S. government.
SIGN UP to receive Scott’s free email newsletter.
CHECK OUT Scott’s latest polls.
Note: Neither Scott Rasmussen, ScottRasmussen.com, nor RMG Research, Inc. have any affiliation with Rasmussen Reports. While Scott Rasmussen founded that firm, he left more than seven years ago and has had no involvement since that time.
Methodology
The survey of 1,200 Registered Voters was conducted by Scott Rasmussen using a mixed mode approach from May 27-29, 2021. Field work for the survey was conducted by RMG Research, Inc. Most respondents were contacted online or via text while 170 were contacted using automated phone polling techniques. Online respondents were selected from a list of Registered Voters and through a process of Random Digital Engagement. Certain quotas were applied, and the sample was lightly weighted by geography, gender, age, race, education, internet usage, and political party to reasonably reflect the nation’s population of Registered Voters. Other variables were reviewed to ensure that the final sample is representative of that population.