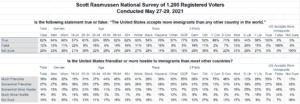
Sixty-five percent (65%) of voters believe that the United States is friendlier to immigrants than most other countries. A Scott Rasmussen national survey found that 20% disagree and believe the U.S. is more hostile towards immigrants.
Those totals include 38% who view the nation as much friendlier towards immigrants than most nations. Just 6% believe it is much more hostile.
Very Liberal voters are fairly evenly divided. Among this group, just 49% believe the U.S. is friendlier than most nations while 41% believe it is more hostile. At the other extreme, 88% of Very Conservative voters believe the U.S. is friendlier than most nations. That includes 75% who say it is much friendlier.
On a partisan basis, 79% of Republicans believe the U.S. is friendlier towards immigrants than other nations. Most Democrats (54%) share that view but 31% see the U.S. as more hostile than most countries. Among Independent voters, 54% see the U.S. as friendlier while 18% say more hostile.
The survey also found that 62% of voters recognize that the United States accepts more immigrants than any other nation in the world. Twelve percent (12%) mistakenly believe that is not true while 26% are not sure.
Those who mistakenly believe that the U.S. does not accept more immigrants than any other nation are far more likely to believe that the United States is more hostile towards immigrants than other nations.
SIGN UP to receive Scott’s free email newsletter.
CHECK OUT Scott’s latest polls.
Note: Neither Scott Rasmussen, ScottRasmussen.com, nor RMG Research, Inc. have any affiliation with Rasmussen Reports. While Scott Rasmussen founded that firm, he left more than seven years ago and has had no involvement since that time.
Methodology
The survey of 1,200 Registered Voters was conducted by Scott Rasmussen using a mixed mode approach from May 27-29, 2021. Field work for the survey was conducted by RMG Research, Inc. Most respondents were contacted online or via text while 170 were contacted using automated phone polling techniques. Online respondents were selected from a list of Registered Voters and through a process of Random Digital Engagement. Certain quotas were applied, and the sample was lightly weighted by geography, gender, age, race, education, internet usage, and political party to reasonably reflect the nation’s population of Registered Voters. Other variables were reviewed to ensure that the final sample is representative of that population.