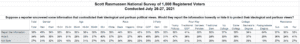
If a reporter uncovered some information that contradicted their ideological and partisan political views, just 39% of voters believe they would report that information honestly. A Scott Rasmussen national survey found that 34% believe they would hide it and 27% are not sure.
By a 50% to 26% margin, Democrats believe journalists would report the information even if it contradicted their own views. By a 45% to 31% margin, Republicans take the opposite view. They tend to believe that reporters would hide the information to protect their ideological and partisan views. Independent voters are evenly divided.
Not surprisingly, voters who prefer Trump-like policies are skeptical. By a 47% to 30% margin, they believe the reporters would hide the information. The much smaller number of voters who prefer traditional Republican policies are evenly divided: 41% believe the information would be reported and 38% believe it would be hidden.
Most urban voters believe reporters would release the information even though it contradicted their own views. A plurality of rural voters take the opposite view and suburban voters are evenly divided.
Two-thirds (64%) of voters with a postgraduate degree trust the reporters to release the information. Among all other voters, opinion is fairly evenly divided.
SIGN UP to receive Scott’s free email newsletter.
CHECK OUT Scott’s latest polls.
Note: Neither Scott Rasmussen, ScottRasmussen.com, nor RMG Research, Inc. have any affiliation with Rasmussen Reports. While Scott Rasmussen founded that firm, he left more than seven years ago and has had no involvement since that time.
Methodology
The survey of 1,000 Registered Voters was conducted online by Scott Rasmussen from July 26-27, 2021. Field work for the survey was conducted by RMG Research, Inc. Respondents were selected from a list of Registered Voters and through a process of Random Digital Engagement. Certain quotas were applied, and the sample was lightly weighted by geography, gender, age, race, education, internet usage, and political party to reasonably reflect the nation’s population of Registered Voters. Other variables were reviewed to ensure that the final sample is representative of that population.