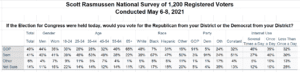
If the election were held today, 41% of Registered Voters would vote for the Democrat from their Congressional District while 40% would vote for the Republican. A Scott Rasmussen national survey found that 6% would vote for some other candidate while 14% are not sure.
That’s a bit closer than last month when Democrats enjoyed a four-point advantage, 43% to 39%.
The tightening results from growing loyalty among GOP voters. Last month, just 85% of GOP voters said they would vote for the Republican from their district. That’s up to 91% now, a figure that matches Democratic support for their party’s candidate.
Just 3% of GOP voters now say they’d vote for the Democrat from their district. That’s down from 6% a month ago.
Independent voters remain evenly divided in both surveys.
As with last month, Democrats lead by a wide margin, 51% to 32%, among voters who are online “almost constantly.” Republicans lead among the rest of the nation’s voters by a 43% to 36% margin. That’s consistent with the fact that 42% of those online constantly are Democrats. Just 27% align with the GOP.
It is impossible to know at this point whether these new numbers reflect a real tightening of the race or are merely statistical noise.
Other recent survey results show that 70% of voters view immigration and border control as a national security issue. Overall, 63% of voters believe that legal immigration is good for the United States while illegal immigration is bad. Just 14% believe both legal and illegal immigration are bad for the nation while 11% believe both are good.
Additionally, 58% of voters believe that drug cartels have more control of the Southern border than the U.S. government. On top of that, 52% believe the Biden Administration is making it too easy for illegal immigrants to enter the nation. Just 28% disagree.
On a different topic, 46% of voters nationwide believe that America is a racist nation. A Scott Rasmussen national survey found that 40% disagree and 14% are not sure.
Finally, by a 49% to 29% margin, voters prefer a more focused $600 Billion infrastructure plan rather than the president’s $1.9 trillion approach.
SIGN UP to receive Scott’s free email newsletter.
CHECK OUT Scott’s latest polls.
Note: Neither Scott Rasmussen, ScottRasmussen.com, nor RMG Research, Inc. have any affiliation with Rasmussen Reports. While Scott Rasmussen founded that firm, he left more than seven years ago and has had no involvement since that time.
Methodology
The online survey of 1,000 Registered Voters was conducted by Scott Rasmussen from May 6-8, 2021. Field work for the survey was conducted by RMG Research, Inc. Respondents were selected from a list of Registered Voters and through a process of Random Digital Engagement. Certain quotas were applied, and the sample was lightly weighted by geography, gender, age, race, education, internet usage, and political party to reasonably reflect the nation’s population of Registered Voters. Other variables were reviewed to ensure that the final sample is representative of that population.