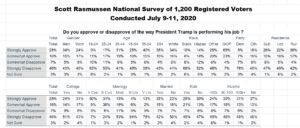
Forty-four percent (44%) of Registered Voters nationwide approve of the way President Trump is performing his job. That’s up five points from a week ago. It’s also the highest level of support the president has enjoyed in a Scott Rasmussen poll since mid-May.
A five-point swing in a single week is unusual and some of the change is likely due to statistical noise. However, it remains to be seen whether this week’s results represent a return to the earlier levels of support for the president.
Prior to mid-May, President Trump’s approval ratings held steady around 45% for several months. However, from late May throughout the month of June, the president’s job was several points lower in a range between 39% and 42%.
This week’s polling found that 88% of Republicans approve of the president’s performance, up eight points from a week ago. That may reflect a positive response among GOP voters to the president’s speech at Mount Rushmore. Media commentary on the speech portrayed it as divisive but many Republicans considered it a strong appeal to unity. The new numbers may also be in response to the media criticism of the president.
The president now also gets positive reviews from 37% of Independents and 12% of Democrats. Both figures are up slightly from a week ago.
The current totals include 28% who Strongly Approve and 46% who Strongly Disapprove.
Recent polling by Scott Rasmussen has also shown that 34% of voters say it will be at least six months before they’ll feel safe in public without a mask. Additionally, 74% Believe Most Americans Generally Get Along Regardless of Race and 24% Support DC Statehood.
LISTEN TO Scott’s Number of the Day podcast
SIGN UP to receive Scott’s free email newsletter.
CHECK OUT Scott’s latest polls.
Methodology
The survey of 1,200 Registered Voters was conducted by Scott Rasmussen using a mixed mode approach from July 9-11, 2020. Field work for the survey was conducted by RMG Research, Inc. Most respondents were contacted online or via text while 117 were contacted using automated phone polling techniques. Certain quotas were applied, and the final sample was lightly weighted by geography, gender, age, race, education, and political party to reasonably reflect the nation’s population of Registered Voters. Other variables were reviewed to ensure that the final sample is representative of that population.