For the third straight week, more than half the nation’s voters believe the worst of the pandemic is still to come. Fifty-six percent (56%) now hold that view, up four points from a week ago.
Throughout August and September, weekly polling showed pessimism about the pandemic gradually declining. During September, fewer than half believed the worst was yet to come. However, that all changed following news that President Trump tested positive for COVID-19.
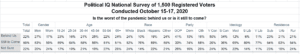
A Political IQ poll conducted by Scott Rasmussen also found that just 22% of Registered Voters now believe the worst is behind us. That’s down five points from a week ago and down seven from the peak optimism measured in early September.
Twenty-seven percent (27%) of men believe the worst is behind us. So do 17% of women.
Forty-one percent (41%) of Republicans now believe the worst is behind us. However, 74% of Democrats and 58% of independents believe the worst is still to come.
The table below highlights selected results showing trends over the past few months.
| Worst of Pandemic is Behind Us | Worst of Pandemic is Still to Come | |
|---|---|---|
| Oct. 8-10 | 27% | 52% |
| Oct. 1-3 | 24% | 55% |
| Sept. 3-5 | 29% | 49% |
| Aug. 13-15 | 20% | 59% |
| July 23-25 | 15% | 63% |
| June 4-6 | 29% | 42% |
| April 9-11 | 16% | 60% |
LISTEN TO Scott’s Podcast.
SIGN UP to receive Scott’s free email newsletter.
CHECK OUT Scott’s latest polls.
Note: Neither Scott Rasmussen, ScottRasmussen.com, nor RMG Research, Inc. have any affiliation with Rasmussen Reports. While Scott Rasmussen founded that firm, he left more than seven years ago and has had no involvement since that time.
Methodology
The survey of 1,500 Registered Voters was conducted by Scott Rasmussen using a mixed mode approach from October 15-17, 2020. Field work for the survey was conducted by RMG Research, Inc. Most respondents were contacted online or via text while 102 were contacted using automated phone polling techniques. Certain quotas were applied to the overall sample and lightly weighted by geography, gender, age, race, education, and political party to reasonably reflect the nation’s population of Registered Voters. Other variables were reviewed to ensure that the final sample is representative of that population.
The margin of error for the full sample is +/- 2.5 percentage points.