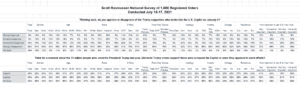
Seventy-two percent (72%) of voters disapprove of the Trump supporters who broke into the U.S. Capitol on January 6. A Scott Rasmussen national survey found that a majority of every measured demographic group shares in that disapproval.
Disapproval comes from 59% of those who prefer Trump-like policies, 63% of conservatives, and 63% of Republicans.
Despite this, 28% of voters mistakenly believe that most Trump supporters supported those who occupied the Capitol. A plurality of Democrats (40%) hold this belief.
Only 18% of voters approve of those who occupied the Capitol.
These results are not substantively different from a survey conducted in January. However, the negative views have softened a bit. In January 82% voiced disapproval, ten points higher than the current totals. Also, in January, 75% Strongly Disapproved. That figure is down to 58% today.
The decline in unfavorable ratings is found across the board.
- Among Democrats, 81% now disapprove. That’s down from 89% in January.
- Among Republicans, there was also an 8-point decline (from 71% to 63%).
- There was a 15-point decline in unfavorables among Independents (from 83% to 68%).
These numbers perhaps suggest a slight fading of interest in the story. The survey found that 38% of voters consider the topic Very Important in terms of how they will vote in the midterm elections. Sixty percent (60%) of Democrats say it’s Very Important along with 22% of Republicans and 20% of Independents.
Forty-five percent (45%) of voters consider the January 6 assault on the U.S. Capitol a major threat to democracy. A slightly larger number–55%– believe letting government bureaucrats set rules without approval of Congress or voters is a major threat to democracy. Twenty-four percent (24%) see the 2017 shooting of Republican members of Congress at a softball practice as a major threat to democracy. Eighteen percent (18%) believe requiring voters to show photo identification before voting is such a threat.
SIGN UP to receive Scott’s free email newsletter.
CHECK OUT Scott’s latest polls.
Note: Neither Scott Rasmussen, ScottRasmussen.com, nor RMG Research, Inc. have any affiliation with Rasmussen Reports. While Scott Rasmussen founded that firm, he left more than seven years ago and has had no involvement since that time.
Methodology
The survey of 1,200 Registered Voters was conducted by Scott Rasmussen using a mixed mode approach from July 15-17, 2021. Field work for the survey was conducted by RMG Research, Inc. Most respondents were contacted online or via text while 179 were contacted using automated phone polling techniques. Online respondents were selected from a list of Registered Voters and through a process of Random Digital Engagement. Certain quotas were applied, and the sample was lightly weighted by geography, gender, age, race, education, internet usage, and political party to reasonably reflect the nation’s population of Registered Voters. Other variables were reviewed to ensure that the final sample is representative of that population.