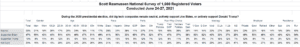
Forty-seven percent (47%) of voters believe Big Tech companies actively supported Joe Biden during the 2020 presidential election. A Scott Rasmussen national survey found that just 10% think they actively supported Donald Trump.
Twenty percent (20%) believe that the companies remained neutral and 23% are not sure.
In every measured demographic group, more voters believed that the companies supported Biden rather than Trump. Even Democrats, by a 3-to-1 margin, held that view.
Other data showed that 78% of voters believe tech companies like Twitter, Facebook, and Google could swing the results of the election to benefit their preferred candidate. Additionally, 62% believe technology companies have too much influence on our politics and political campaigns.
Section 230 of the Communications Decency Act gives big tech companies special immunity from prosecution for things posted on their platforms. Since they received this immunity from the government, 63% of voters believe they should they be required to abide by the 1st Amendment guarantee of free speech.
Sixty-eight percent (68%) of voters believe it is more important to ensure that social media companies operate fairly rather than protecting the companies from government interference. A Scott Rasmussen national survey found that 19% disagree and believe protecting social media companies from government interference is the higher priority.
SIGN UP to receive Scott’s free email newsletter.
CHECK OUT Scott’s latest polls.
Note: Neither Scott Rasmussen, ScottRasmussen.com, nor RMG Research, Inc. have any affiliation with Rasmussen Reports. While Scott Rasmussen founded that firm, he left more than seven years ago and has had no involvement since that time.
Methodology
The online survey of 1,000 Registered Voters was conducted by Scott Rasmussen on June 24-27, 2021. Field work for the survey was conducted by RMG Research, Inc. Certain quotas were applied, and the sample was lightly weighted by geography, gender, age, race, education, internet usage, and political party to reasonably reflect the nation’s population of Registered Voters. Other variables were reviewed to ensure that the final sample is representative of that population.