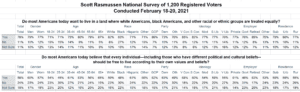
Fifty-eight percent (58%) of voters support the founding ideal of individual freedom. More precisely, they believe most Americans today believe that every individual—including those who have different political and cultural beliefs— should be free to live according to their own values and beliefs. A Scott Rasmussen national survey found that 24% disagree and 18% are not sure.
Sixty-one percent (61%) of Hispanic voters believe most Americans share that commitment to individual freedom along with 59% of White voters. Black voters are a bit less confident. Forty-eight percent (48%) believe most Americans believe everyone should be free to live according to their own values. However, 30% of Black voters disagree.
Sixty-three percent (63%) of retired voters believe most Americans are committed to individual freedom. So do 61% of private sector workers agree. However, only 46% of government employees share that optimism.
A separate survey question found that 78% believe most Americans today want to live in a land where White Americans, Black Americans, and other racial or ethnic groups are treated equally. That view is shared by a majority of every measured demographic group.
SIGN UP to receive Scott’s free email newsletter.
CHECK OUT Scott’s latest polls.
Note: Neither Scott Rasmussen, ScottRasmussen.com, nor RMG Research, Inc. have any affiliation with Rasmussen Reports. While Scott Rasmussen founded that firm, he left more than seven years ago and has had no involvement since that time.
Methodology
The survey of 1,200 Registered Voters was conducted by Scott Rasmussen using a mixed mode approach from February 18-20, 2021. Field work for the survey was conducted by RMG Research, Inc. Most respondents were contacted online or via text while 212 were contacted using automated phone polling techniques. Online respondents were selected from a list of Registered Voters and through a process of Random Digital Engagement. Certain quotas were applied, and the sample was lightly weighted by geography, gender, age, race, education, and political party to reasonably reflect the nation’s population of Registered Voters. Other variables were reviewed to ensure that the final sample is representative of that population.