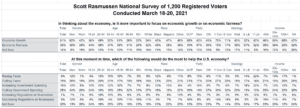
When thinking about the economy, 51% of voters believe it is more important to focus on economic growth than economic fairness. Another 35% take the opposite view while 14% are not sure.
Sixty-eight percent (68%) of Republicans see economic growth as more important while Democrats are more evenly divided. Forty-seven percent (47%) of those in Joe Biden’s party prefer a focus on fairness while 43% say growth.
As for Independent voters, 45% want the focus on growth and 36% want it on fairness.
At this moment in time, 25% of voters say cutting government spending would do the most to help the U.S. economy. Nineteen percent (19%) say cutting taxes would be best. Ten percent (10%) see increased government spending as most helpful while 9% say it’s cutting regulations on businesses. Another 9% believe higher taxes is the best policy for the economy while 7% favor increased regulation. Twenty percent (20%) are not sure.
Those who believe focusing on economic growth is the most important rated cutting spending and taxes as the best prescriptions. So do those who would rather focus on economic fairness.
All told, the numbers show that 53% believe reducing government involvement would be best for the economy while 26% believe the economy would benefit most from an increase in the role of government.
SIGN UP to receive Scott’s free email newsletter.
CHECK OUT Scott’s latest polls.
Note: Neither Scott Rasmussen, ScottRasmussen.com, nor RMG Research, Inc. have any affiliation with Rasmussen Reports. While Scott Rasmussen founded that firm, he left more than seven years ago and has had no involvement since that time.
Methodology
The survey of 1,200 Registered Voters was conducted by Scott Rasmussen using a mixed mode approach from March 18-20, 2021. Field work for the survey was conducted by RMG Research, Inc. Most respondents were contacted online or via text while 201 were contacted using automated phone polling techniques. Online respondents were selected from a list of Registered Voters and through a process of Random Digital Engagement. Certain quotas were applied, and the sample was lightly weighted by geography, gender, age, race, education, and political party to reasonably reflect the nation’s population of Registered Voters. Other variables were reviewed to ensure that the final sample is representative of that population.