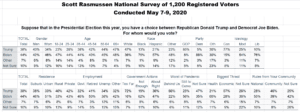
The latest Scott Rasmussen national survey of 1,200 Registered Voters shows Joe Biden leading Donald Trump by six points– 44% to 38%. Seven percent (7%) would cast their ballot for some other candidate and 10% are undecided.
The candidates are essentially even among men and voters over 45. Biden leads by double digits among women and voters under 35.
Three weeks ago. Biden was up by nine points. Two weeks ago, he led by eight. Last week, the lead had slipped to seven. This brings the race back to where it was in late March, when Biden enjoyed a five point advantage.
Thirty-eight percent (38%) of voters nationwide believe it would be appropriate to continue the lockdowns in their own neighborhood and community. However, 57% disagree. Most believe the rules and guidelines should be established locally.
Sixty-five percent (65%) are concerned that public officials are using the pandemic as an excuse to infringe upon the Constitutional rights of individual Americans. That total includes 39% who are Very Concerned.
Fifty-five percent (55%) believe the nation needs stricter immigration policies going forward.
Twenty-six percent (26%) of voters nationwide consider trade policies to be primarily a national security issue. However, most clearly see trade policy than raw economics. Most voters (58%) say ensuring that important materials are produced in the United States is a higher priority than keeping costs down. Just 28% say keeping costs down and promoting economic growth matters more.
Finally, many voters are convinced the polls were wrong in 2016. Actually, the polls were pretty good. However, the analysis and interpretation of those polls was horrible.
SIGN UP to receive Scott’s free email newsletter.
CHECK OUT Scott’s latest polls.
The survey of 1,200 Registered Voters was conducted by Scott Rasmussen using a mixed mode approach from May 7-9, 2020. Field work for the survey was conducted by RMG Research, Inc. Most respondents were contacted online while 174 were contacted using automated phone polling techniques. Certain quotas were applied and the overall sample and lightly weighted by geography, gender, age, race, and political party to reasonably reflect the nation’s population of Registered Voters. Other variables were reviewed to ensure that the final sample is representative of that population.