
April 28, 2020– The latest Scott Rasmussen poll of 1,000 Registered Voters shows Joe Biden leading Donald Trump by eight points– 46% to 38%. Six percent (6%) would cast their ballot for some other candidate and 9% are undecided.
That’s little changed from a week ago when a poll conducted by Scott Rasmussen for JustTheNews.com showed Biden with a nine-point advantage. In that poll, Biden led 49% to 40%. Interestingly, support for both candidates dropped a bit in the most recent poll.
In late March, it was Biden 45% Trump 40%.
While the results suggest a close race in the fall, it is important to keep in mind the extraordinary circumstances of the coronavirus lockdowns. What happens in the coming months as American society re-opens is likely to have a significant impact on the race. Currently, 23% of voters believe the worst of the pandemic is behind us, an increase of seven points over the past two weeks.
Thirty-three percent (33%) believe the government has not yet gone far enough in responding to the pandemic. That figure is down eight points since late March.
Other polling shows that 51% of American voters favor a proposal that would allow all who are not sick or vulnerable in their area to return to work. Thirty-eight percent (38%) are opposed, and 10% are not sure. That question was framed in the context of the area that the respondents lived in. These numbers are not a call for a national rule, but a recognition that different dynamics exist in different communities.
Scott Rasmussen is now providing virtual briefings about the impact of the pandemic on business, politics, and American society. If you’d like Scott to provide a briefing for your company or organization, please contact Shawn Hanks.
SIGN UP to receive Scott’s free email newsletter.
CHECK OUT Scott’s latest polls.
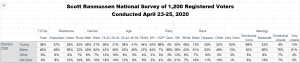
The survey of 1,200 Registered Voters was conducted by Scott Rasmussen using a mixed mode approach from April 23-25, 2020. Field work for the survey was conducted by RMG Research, Inc. Most respondents were contacted online while 272 were contacted using automated phone polling techniques. Certain quotas were applied to the overall sample and lightly weighted by geography, gender, age, race, and political party to reasonably reflect the nation’s population of Registered Voters. Other variables were reviewed to ensure that the final sample is representative of that population.