

Twenty-three percent (23%) of voters nationwide now believe the worst of the pandemic is behind us. That’s up seven points from just 16% two weeks ago.
A Scott Rasmussen national survey also found that 49% believe the worst is still to come. That’s down 11 points from 60% in the earlier survey.
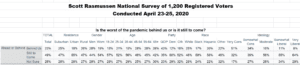
The survey also found that, if infected by the coronavirus, 24% of Registered Voters nationwide are not confident they could receive appropriate medical treatment. That’s down from 30% two weeks ago. The number who are Not at All Confident about access to treatment has fallen from 10% to 6%.
The partisan divides remain very significant and most of the increased confidence comes from Republicans.
Sixty percent (60%) of Democrats believe the worst is yet to come, down from 72% earlier. Among Independent voters, 52% now believe the worst days remain ahead of us (down from 58%).
However, Republicans perceive things much differently. By a 43% to 35% margin, a plurality of GOP voters now believe the worst is behind us. Two weeks ago, just 28% of Republicans thought the worst was behind us. Forty-nine percent (49%) believed the worst was still to come.
Data released earlier showed that 22% believe our nation’s response to the pandemic would have been better if private insurance companies were banned and all health coverage was provided by the federal government. However, a Scott Rasmussen national survey found that 38% believe things would be worse.
Overall, 34% of voters at least somewhat favor the idea of banning private insurance companies to create a national health care system. Fifty-four percent (54%) are opposed.
SIGN UP to receive Scott’s free email newsletter.
CHECK OUT Scott’s latest polls.
The survey of 1,200 Registered Voters was conducted by Scott Rasmussen using a mixed mode approach from April 23-25, 2020. Field work for the survey was conducted by RMG Research, Inc. Most respondents were contacted online while 272 were contacted using automated phone polling techniques. Certain quotas were applied to the overall sample and lightly weighted by geography, gender, age, race, and political party to reasonably reflect the nation’s population of Registered Voters. Other variables were reviewed to ensure that the final sample is representative of that population.