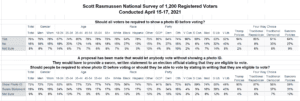
Seventy-six percent (76%) of Registered Voters believe all voters should be required to show a photo ID before voting. A Scott Rasmussen national survey found that just 16% are opposed and 8% are not sure.
H.R. 1, a bill intended to remake the nation’s voting laws, would ban photo ID requirements. That proposed legislation passed the House on a party-line vote and is to be considered by the Senate.
Advocates of H.R. 1, also known as the “For the People Act,” argue that the bill would not technically ban photo ID requirements. In their view, the legislation simply provides a workaround for people who don’t have photo IDs. They would be allowed to vote by providing a sworn, written statement to an election official stating that they are eligible to vote. However, only 19% of voters consider that an acceptable substitute. Seventy-three percent (73%) are opposed.
This is one issue that unites the Trump and establishment wings of the Republican party. Among those who prefer Trump like policies, 90% oppose the idea of letting people submit a written statement rather than photo ID. So do 87% of those who would prefer traditional Republican policies.
Seventy-two percent (72%) of Independent voters oppose letting people vote by simply submitting a written statement. So do 56% of Democrats.
SIGN UP to receive Scott’s free email newsletter.
CHECK OUT Scott’s latest polls.
Note: Neither Scott Rasmussen, ScottRasmussen.com, nor RMG Research, Inc. have any affiliation with Rasmussen Reports. While Scott Rasmussen founded that firm, he left more than seven years ago and has had no involvement since that time.
Methodology
The survey of 1,200 Registered Voters was conducted by Scott Rasmussen using a mixed mode approach from April 22-24, 2021. Field work for the survey was conducted by RMG Research, Inc. Most respondents were contacted online or via text while 203 were contacted using automated phone polling techniques. Online respondents were selected from a list of Registered Voters and through a process of Random Digital Engagement. Certain quotas were applied, and the sample was lightly weighted by geography, gender, age, race, education, internet usage, and political party to reasonably reflect the nation’s population of Registered Voters. Other variables were reviewed to ensure that the final sample is representative of that population.