In terms of offering freedom and equality, 62% of voters believe the United States is better than most other nations. A Scott Rasmussen national survey found that 11% disagree and say the U.S. is worse than most other nations. Seventeen percent (17%) rate our country about the same as most other nations and 9% are not sure.
Seventy-four percent (74%) of Republicans believe the U.S. is better than most nations when it comes to offering freedom and equality. Democrats, by a 57% to 14% margin, agree. Among Independent voters 46% say the U.S. is better than most while 11% say it’s worse.
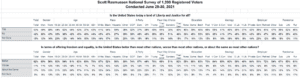
While voters think our nation is better than most, there is also a recognition that more needs to be done. Just 43% believe the United States today is a land of liberty and justice for all. Forty-two percent (42%) disagree and 15% are not sure.
Sixty-three percent (63%) of Hispanic voters see the U.S. as a land of liberty and justice for all. That view is shared by 44% of Black voters and 41% of White voters.
Ninety-three percent (93%) nationwide recognize that racism has played a major role in America’s history. However, just 20% believe America was founded on racism and that we should start over with something new. Seventy percent (70%) of voters believe the Civil Rights Movement of the 1960s helped the United States move closer to living out its founding ideals of freedom, equality, and self-governance.
SIGN UP to receive Scott’s free email newsletter.
CHECK OUT Scott’s latest polls.
Note: Neither Scott Rasmussen, ScottRasmussen.com, nor RMG Research, Inc. have any affiliation with Rasmussen Reports. While Scott Rasmussen founded that firm, he left more than seven years ago and has had no involvement since that time.
Methodology
The online survey of 1,000 Registered Voters was conducted by Scott Rasmussen on June 29-30, 2021. Field work for the survey was conducted by RMG Research, Inc. Certain quotas were applied, and the sample was lightly weighted by geography, gender, age, race, education, internet usage, and political party to reasonably reflect the nation’s population of Registered Voters. Other variables were reviewed to ensure that the final sample is representative of that population.