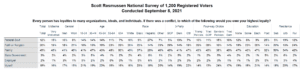
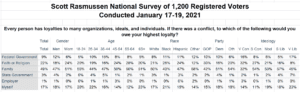
25% Okay With Christians Imposing Views on Society; 19% Say Same About Atheists

Twenty-five percent (25%) of voters believe it is appropriate for Christians to impose their values and beliefs on atheists and society at large. A Scott Rasmussen national survey found that 60% disagree and 15% are not sure.

At the same time, 19% believe it is appropriate for atheists to impose their values and beliefs on Christians and society at large. On that question, 70% disagree and 11% are not sure.

Voters who hold stronger ideological views are somewhat more supportive of having such groups impose their views on society. That includes both Very Liberal and Very Conservative voters.

SIGN UP to receive Scott’s free email newsletter.

CHECK OUT Scott’s latest polls.

Note: Neither Scott Rasmussen, ScottRasmussen.com, nor RMG Research, Inc. have any affiliation with Rasmussen Reports. While Scott Rasmussen founded that firm, he left more than seven years ago and has had no involvement since that time.

Methodology

The survey of 1,200 Registered Voters was conducted by Scott Rasmussen using a mixed mode approach from June 3-5, 2021. Field work for the survey was conducted by RMG Research, Inc. Most respondents were contacted online or via text while 237 were contacted using automated phone polling techniques. Online respondents were selected from a list of Registered Voters and through a process of Random Digital Engagement. Certain quotas were applied, and the sample was lightly weighted by geography, gender, age, race, education, internet usage, and political party to reasonably reflect the nation’s population of Registered Voters. Other variables were reviewed to ensure that the final sample is representative of that population.

Posted in Poll Results | Tagged ,

Scott's Newsletter
Sign up for Scott's newsletter and get his political insight delivered right to your inbox!

58% Believe Most Americans Support Letting Those With Different Values to Live According to Those Values

Fifty-eight percent (58%) of voters support the founding ideal of individual freedom. More precisely, they believe most Americans today believe that every individual—including those who have different political and cultural beliefs— should be free to live according to their own values and beliefs. A Scott Rasmussen national survey found that 24% disagree and 18% are not sure.

Sixty-one percent (61%) of Hispanic voters believe most Americans share that commitment to individual freedom along with 59% of White voters. Black voters are a bit less confident. Forty-eight percent (48%) believe most Americans believe everyone should be free to live according to their own values. However, 30% of Black voters disagree.

Sixty-three percent (63%) of retired voters believe most Americans are committed to individual freedom. So do 61% of private sector workers agree. However, only 46% of government employees share that optimism.

A separate survey question found that 78% believe most Americans today want to live in a land where White Americans, Black Americans, and other racial or ethnic groups are treated equally. That view is shared by a majority of every measured demographic group.

SIGN UP to receive Scott’s free email newsletter.

CHECK OUT Scott’s latest polls.

Note: Neither Scott Rasmussen, ScottRasmussen.com, nor RMG Research, Inc. have any affiliation with Rasmussen Reports. While Scott Rasmussen founded that firm, he left more than seven years ago and has had no involvement since that time.

Methodology

The survey of 1,200 Registered Voters was conducted by Scott Rasmussen using a mixed mode approach from February 18-20, 2021. Field work for the survey was conducted by RMG Research, Inc. Most respondents were contacted online or via text while 212 were contacted using automated phone polling techniques. Online respondents were selected from a list of Registered Voters and through a process of Random Digital Engagement. Certain quotas were applied, and the sample was lightly weighted by geography, gender, age, race, education, and political party to reasonably reflect the nation’s population of Registered Voters. Other variables were reviewed to ensure that the final sample is representative of that population.

Posted in Poll Results | Tagged ,

Scott's Newsletter
Sign up for Scott's newsletter and get his political insight delivered right to your inbox!

When Law & Faith Conflict, Voters Evenly Divided on Which to Follow

Sometimes there is a conflict between government laws and the teachings of a faith or religion. For most voters, this creates some tension since faith is an important part of their daily life.

If they felt a government law forced them to violate the teachings and values of their faith, 39% of voters would be likely to follow the teachings of their faith. A Scott Rasmussen survey found that 41% would follow the law and 19% are not sure. The number who say they would follow the law includes 15% who say that faith or religion is not at all important to them.

White voters are evenly divided on the subject. By a 45% to 34% margin, Black voters would follow their faith.

Republicans would be more likely to follow their faith while Democrats would be more likely to follow the law. Independent voters are evenly divided.

As on many issues, there is an interesting divide between the views of White and Black Democrats. By a 56% to 25% margin, White Democrats would follow the law. By a 42% to 34% margin, Black Democrats would follow their faith.

This survey was conducted immediately following the nomination of Judge Amy Coney Barrett to the Supreme Court.

LISTEN TO Scott’s Podcast.

SIGN UP to receive Scott’s free email newsletter.

CHECK OUT Scott’s latest polls.

Note: Neither Scott Rasmussen, ScottRasmussen.com, nor RMG Research, Inc. have any affiliation with Rasmussen Reports. While Scott Rasmussen founded that firm, he left more than seven years ago and has had no involvement since that time.

Methodology

The survey of 1,000 Registered Voters was conducted online by Scott Rasmussen September 26, 2020. Field work for the survey was conducted by RMG Research, Inc.  Certain quotas were applied to the overall sample and lightly weighted by geography, gender, age, race, education, and political party to reasonably reflect the nation’s population of Registered Voters. Other variables were reviewed to ensure that the final sample is representative of that population.

Posted in Poll Results | Tagged ,

Scott's Newsletter
Sign up for Scott's newsletter and get his political insight delivered right to your inbox!