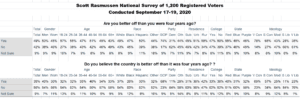
As Election 2020 approaches, 49% of the nation’s Registered Voters are better off than they were four years ago. A Scott Rasmussen national survey found that 42% are not while 9% are not sure.
Men, by a 53% to 38% margin, say they are better off. Women are evenly divided.
Most Republicans (74%) say they are better off while most Democrats (62%) say they are not. Independent voters are evenly divided.
Partially echoing this partisan result, Red State voters say they are better off by a 55% to 37% margin. Blue State voters are evenly divided, as are those in Purple States.
Red States are defined as those President Trump won by at least four points in 2016. Blue States are those Hillary Clinton won by at least four points. Purple States are those whose results were closer.
While a plurality of voters believe they are personally better off, just 35% believe the country is better off than it was four years ago. Most voters (56%) disagree and say it is not better off. In Blue States, 60% say the country is not better off. Fifty-eight percent (58%) of voters in Purple states agree with that negative assessment. So do 51% of Red States voters.
LISTEN TO Scott’s Podcast.
SIGN UP to receive Scott’s free email newsletter.
CHECK OUT Scott’s latest polls.
Note: Neither Scott Rasmussen, ScottRasmussen.com, nor RMG Research, Inc. have any affiliation with Rasmussen Reports. While Scott Rasmussen founded that firm, he left more than seven years ago and has had no involvement since that time.
Methodology
The survey of 1,200 Registered Voters was conducted by Scott Rasmussen using a mixed mode approach from September 17-19, 2020. Field work for the survey was conducted by RMG Research, Inc. Most respondents were contacted online or via text while 161 were contacted using automated phone polling techniques. Certain quotas were applied to the overall sample and lightly weighted by geography, gender, age, race, education, and political party to reasonably reflect the nation’s population of Registered Voters. Other variables were reviewed to ensure that the final sample is representative of that population.