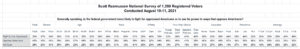
Forty-three percent (43%) of voters believe the federal government is more likely to oppress Americans rather than fight for the oppressed. A Scott Rasmussen national survey found that 30% take the opposite view and 26% are not sure.
By a 55% to 22% margin, Republicans believe the federal government is more likely to use its power in ways that oppress Americans. By a 44% to 12% margin, Independent voters agree.
Democrats, however, see things differently. By a 45% to 32% margin, those in President Biden’s party think the federal government is more likely to fight for oppressed Americans.
Urban voters tend to see the federal government fighting for the oppressed. Suburban and rural voters think it is more likely to oppress Americans.
A March survey found that 59% of voters believe the federal government is a special interest group that looks out primarily for its own interests. Just 17% disagree and 23% are not sure.
A majority of every measured demographic group sees the federal government as a special interest group. That includes 68% of Republicans, 61% of Independent voters, and 51% of Democrats.
Other data showed that 41% of voters believe the benefits of government are worth the costs and regulations. Thirty-three percent (33%) disagree.
SIGN UP to receive Scott’s free email newsletter.
CHECK OUT Scott’s latest polls.
Note: Neither Scott Rasmussen, ScottRasmussen.com, nor RMG Research, Inc. have any affiliation with Rasmussen Reports. While Scott Rasmussen founded that firm, he left more than seven years ago and has had no involvement since that time.
Methodology
The survey of 1,200 Registered Voters was conducted online by Scott Rasmussen from August 10-11, 2021. Field work for the survey was conducted by RMG Research, Inc. Respondents were selected from a list of Registered Voters and through a process of Random Digital Engagement. Certain quotas were applied, and the sample was lightly weighted by geography, gender, age, race, education, internet usage, and political party to reasonably reflect the nation’s population of Registered Voters. Other variables were reviewed to ensure that the final sample is representative of that population.