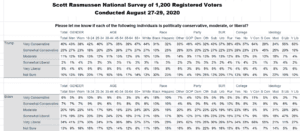
Fifty-five percent (55%) of voters nationwide see Joe Biden as politically liberal while 20% say he’s a moderate. A Scott Rasmussen national survey also found that 13% consider the former Vice President to be politically conservative while another 13% are not sure.
As for President Trump, 65% view him as conservative, 11% say moderate, 7% liberal, and 16% are not sure.
Republican voters draw clearer ideological contrasts than other voters. Eighty-one percent (81%) of Republicans see Trump as a conservative while 74% see Biden as a liberal. Among Democrats, 60% see Trump as conservative and 46% view Biden as liberal.
When it comes to the Vice Presidential running mates, the numbers for Senator Kamala Harris is viewed in almost identical ideological terms as Biden. That’s not surprising, especially given that all many voters know about Harris is that Biden selected her for the ticket. It is possible, though far from certain, that voters may begin to see Harris in a different ideological light between now and November.
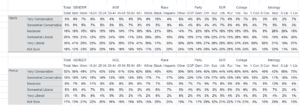
On the other hand, Vice President Mike Pence is seen as a bit more conservative than President Trump. Fifty-two percent (52%) of voters see Pence as Very Conservative. Just 40% say the same about Trump. The perspective that Pence is more conservative than Trump is shared by Republicans, Democrats, and Independents.
LISTEN TO Scott’s Daily Podcast.
SIGN UP to receive Scott’s free email newsletter.
CHECK OUT Scott’s latest polls.
FOLLOW Scott on Twitter.
ORDER Scott’s latest book: The Sun is Still Rising: Politics Has Failed But America Will Not.
Methodology
The survey of 1,200 Registered Voters was conducted by Scott Rasmussen using a mixed mode approach from August 27-29, 2020. Field work for the survey was conducted by RMG Research, Inc. Most respondents were contacted online or via text while 188 were contacted using automated phone polling techniques. Certain quotas were applied to the overall sample and lightly weighted by geography, gender, age, race, education, and political party to reasonably reflect the nation’s population of Registered Voters. Other variables were reviewed to ensure that the final sample is representative of that population.