Generic Congressional Ballot: GOP 42% Dems 40%

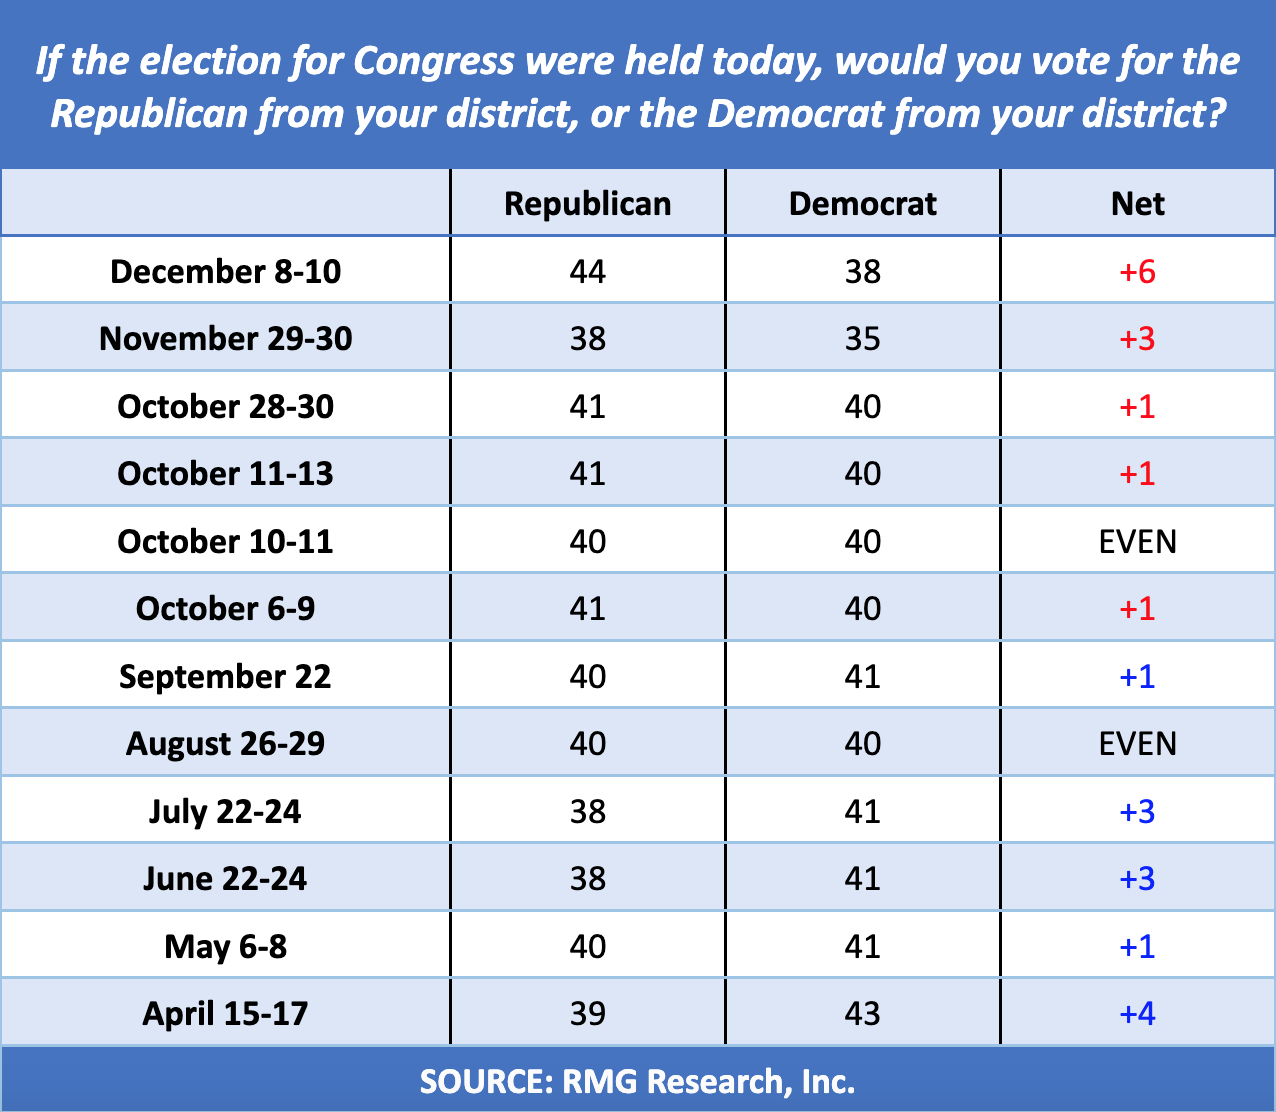
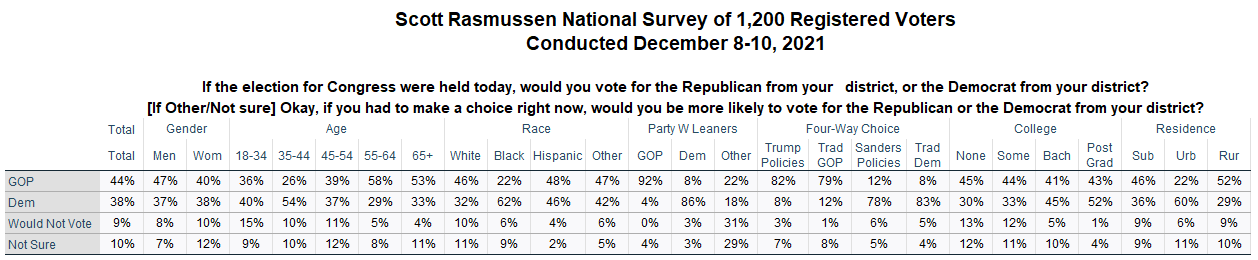
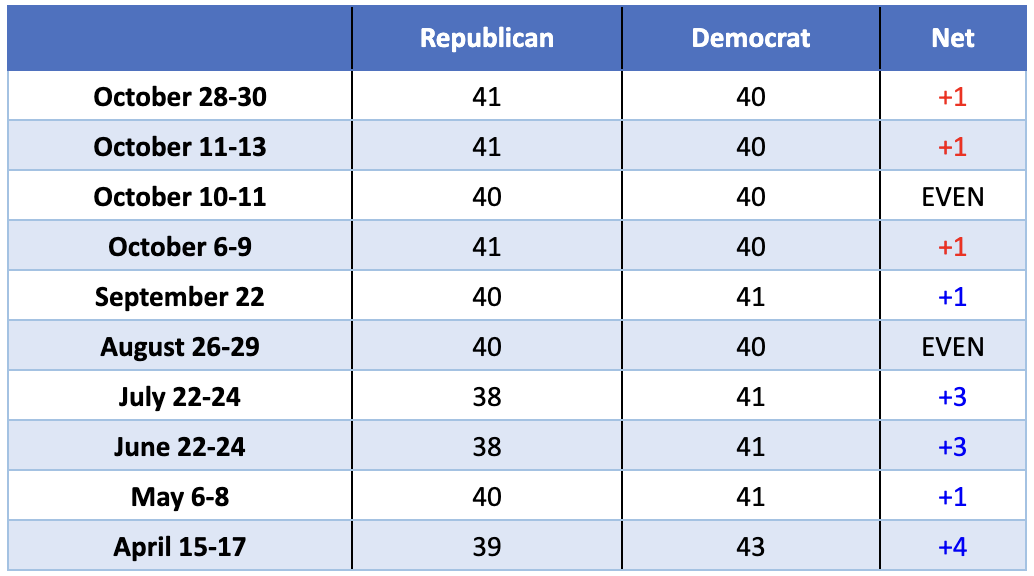
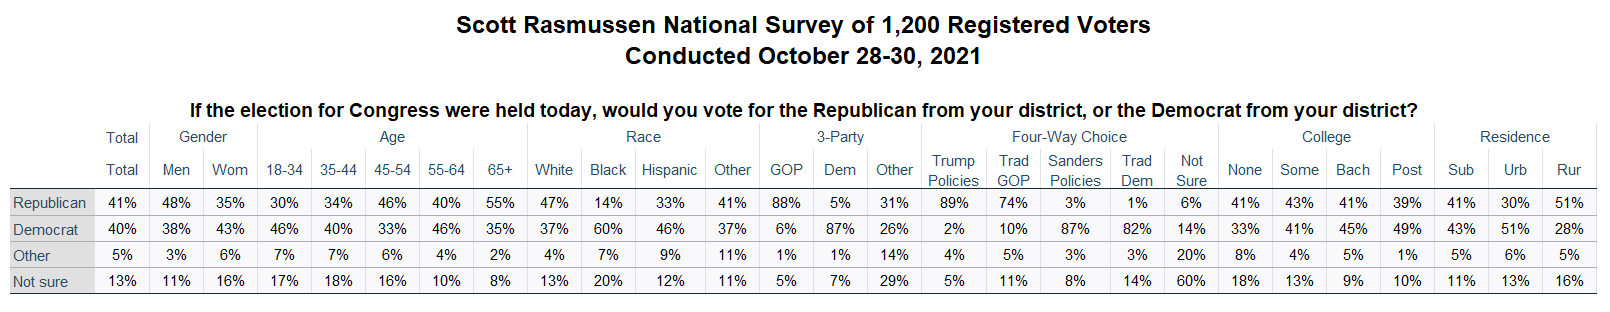
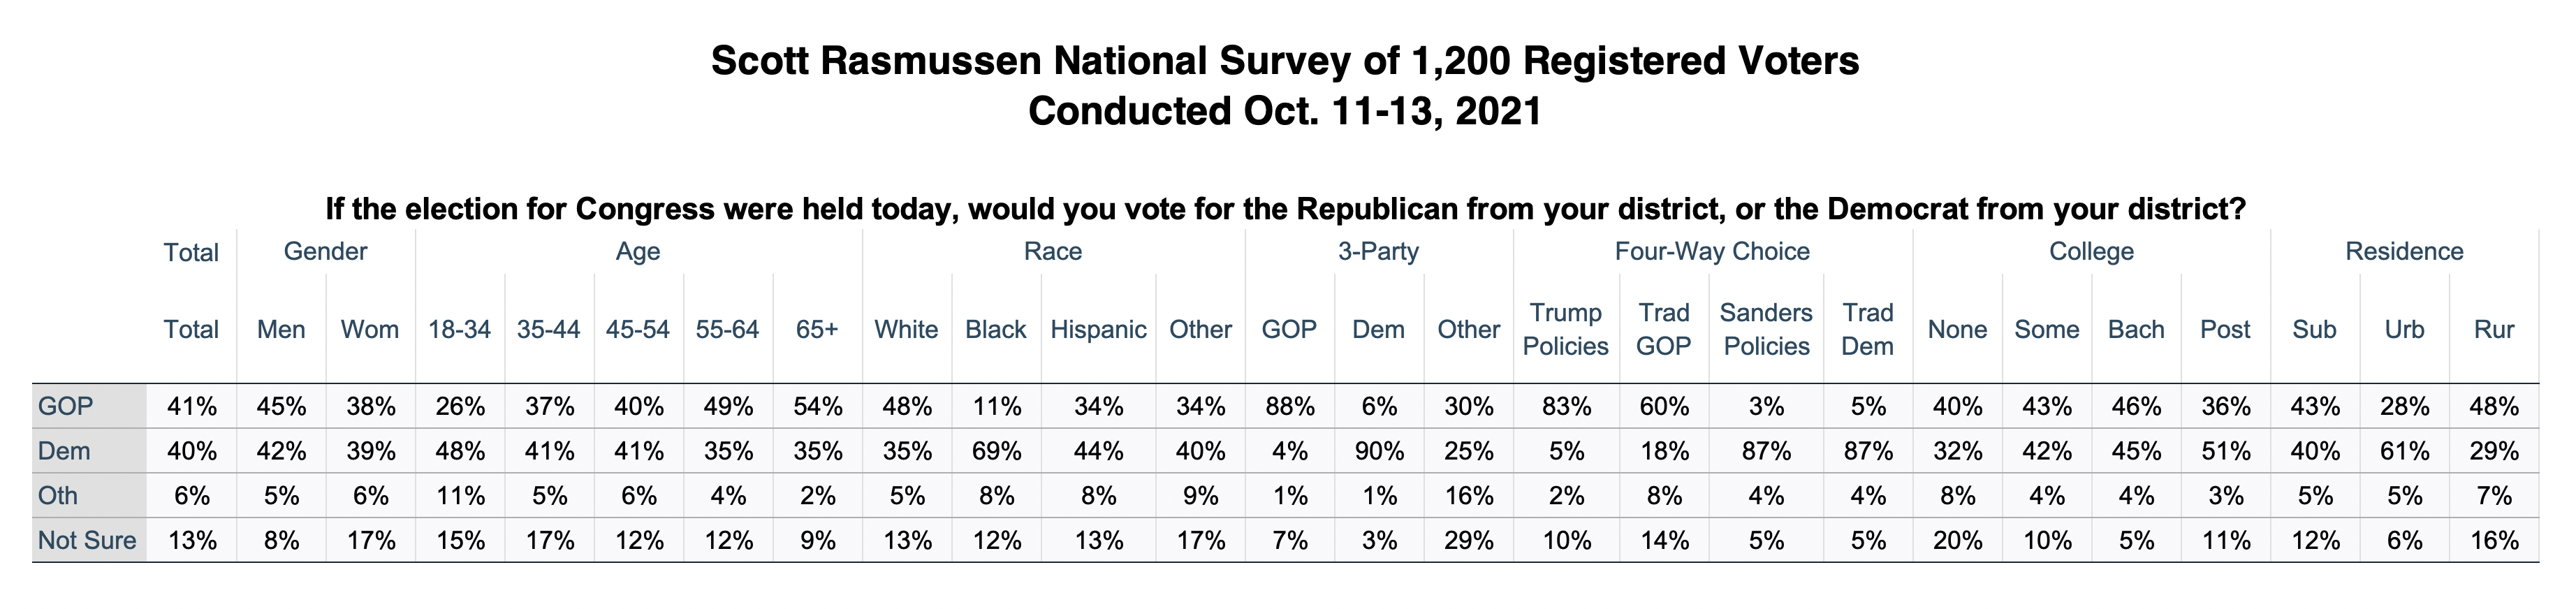
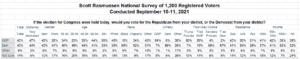
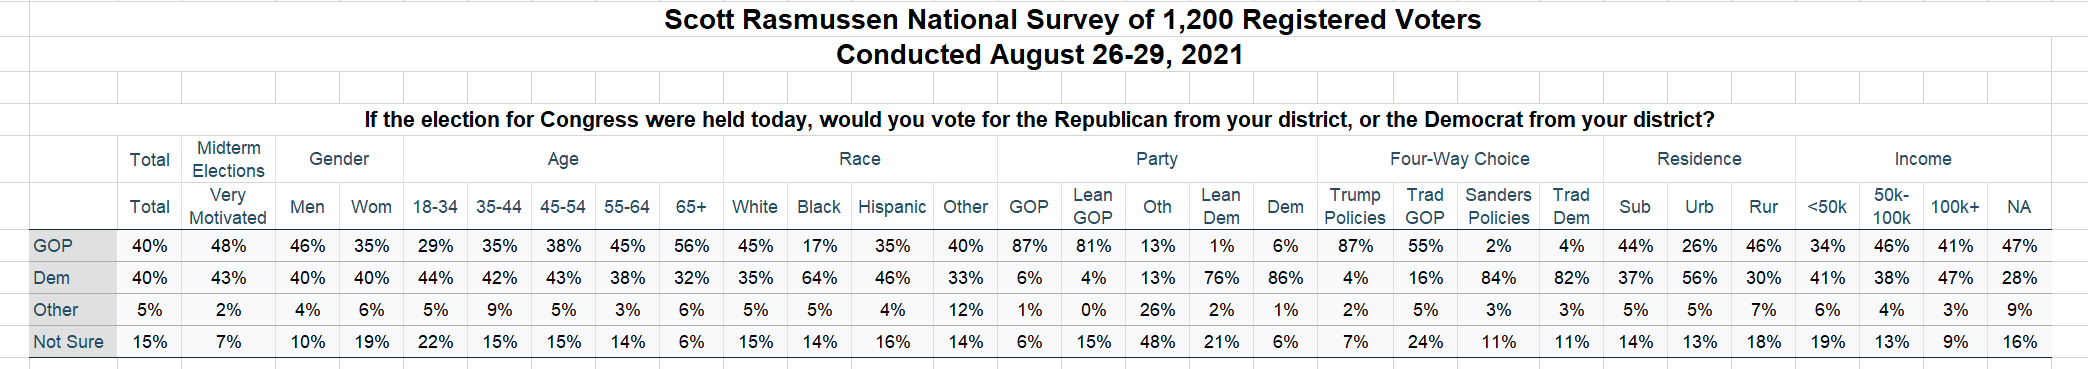
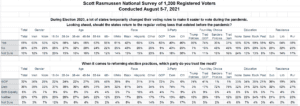
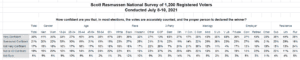
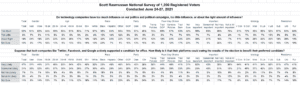
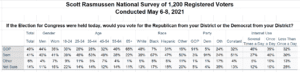
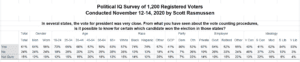
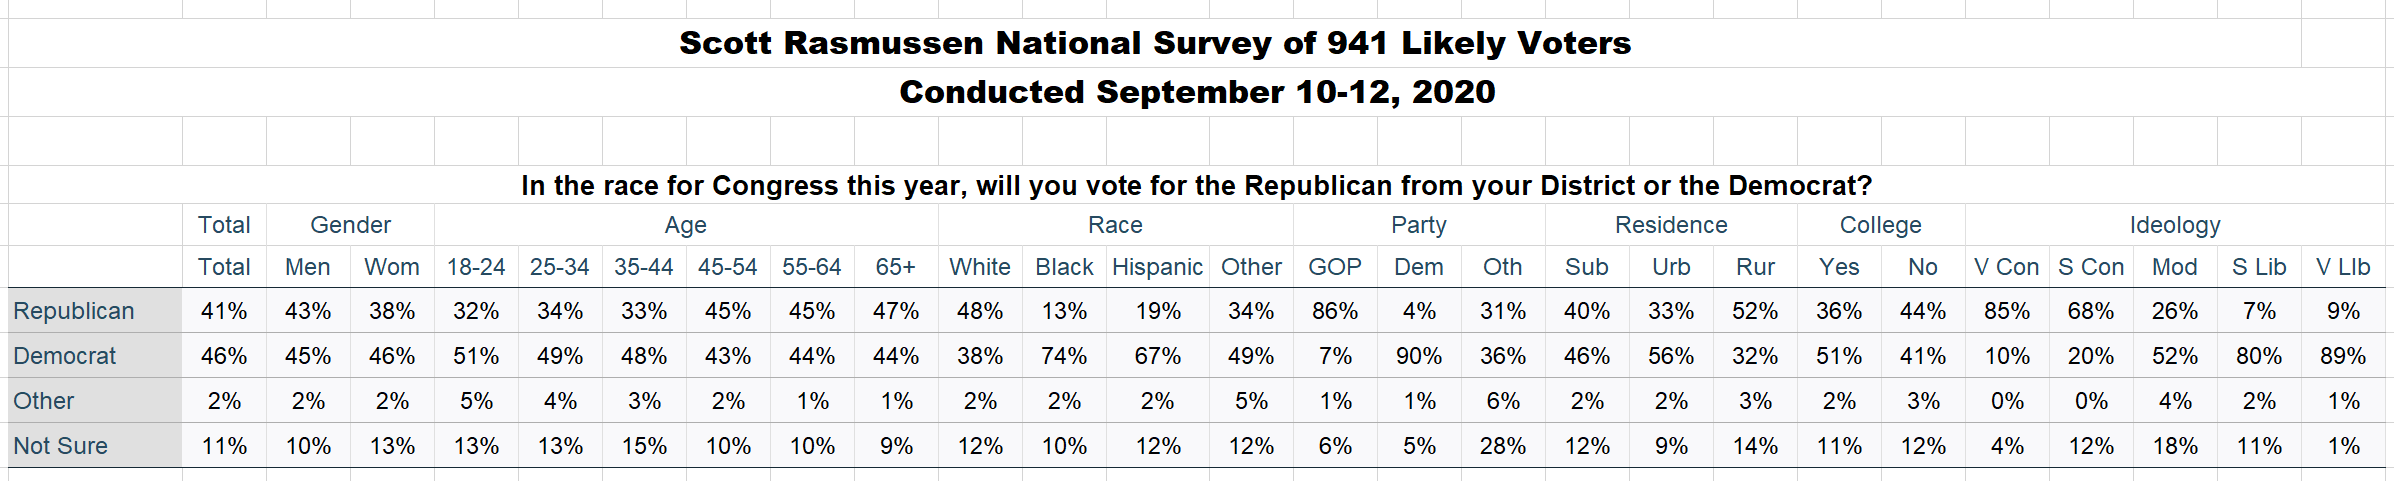
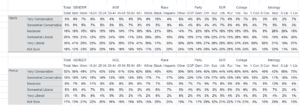
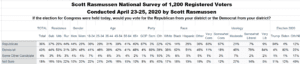
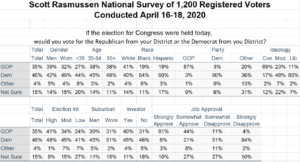
If the midterm elections were held today, 42% of Registered Voters would cast their ballot for a Republican while 40% would vote for a Democrat. The latest Scott Rasmussen national survey found that 8% would vote for some other candidate and 10% are not sure.

These results include “leaners.” They are people who initially express no preference for either party. However, on a follow-up question, they indicate a preference if they had to make a choice right now. Without leaners, the Republican advantage on this latest survey was two percentage points this month and three percentage points in December.

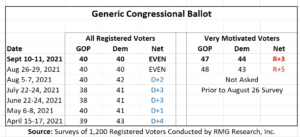
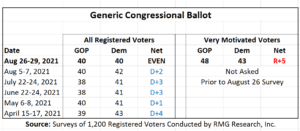
It is important to note that these totals are for Registered Voters and do not account for intensity of support or intention to vote. Generally speaking, Republicans and conservatives show more enthusiasm about the midterms than Democrats and progressives.

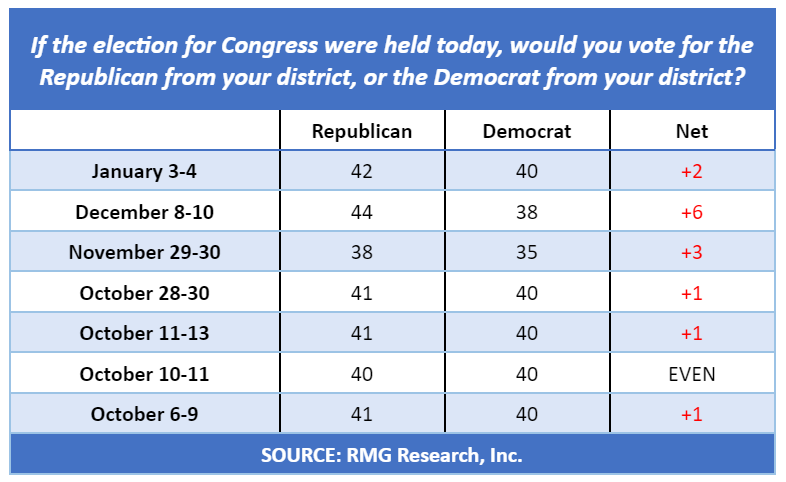
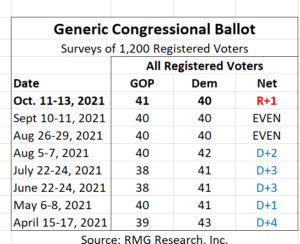
Last month, the GOP held a six point advantage on the Generic Ballot.

Looking back a bit further, Democrats never trailed on the Generic Ballot from the beginning of the year through September. Since October, however, it is the Republican Party that has never trailed.

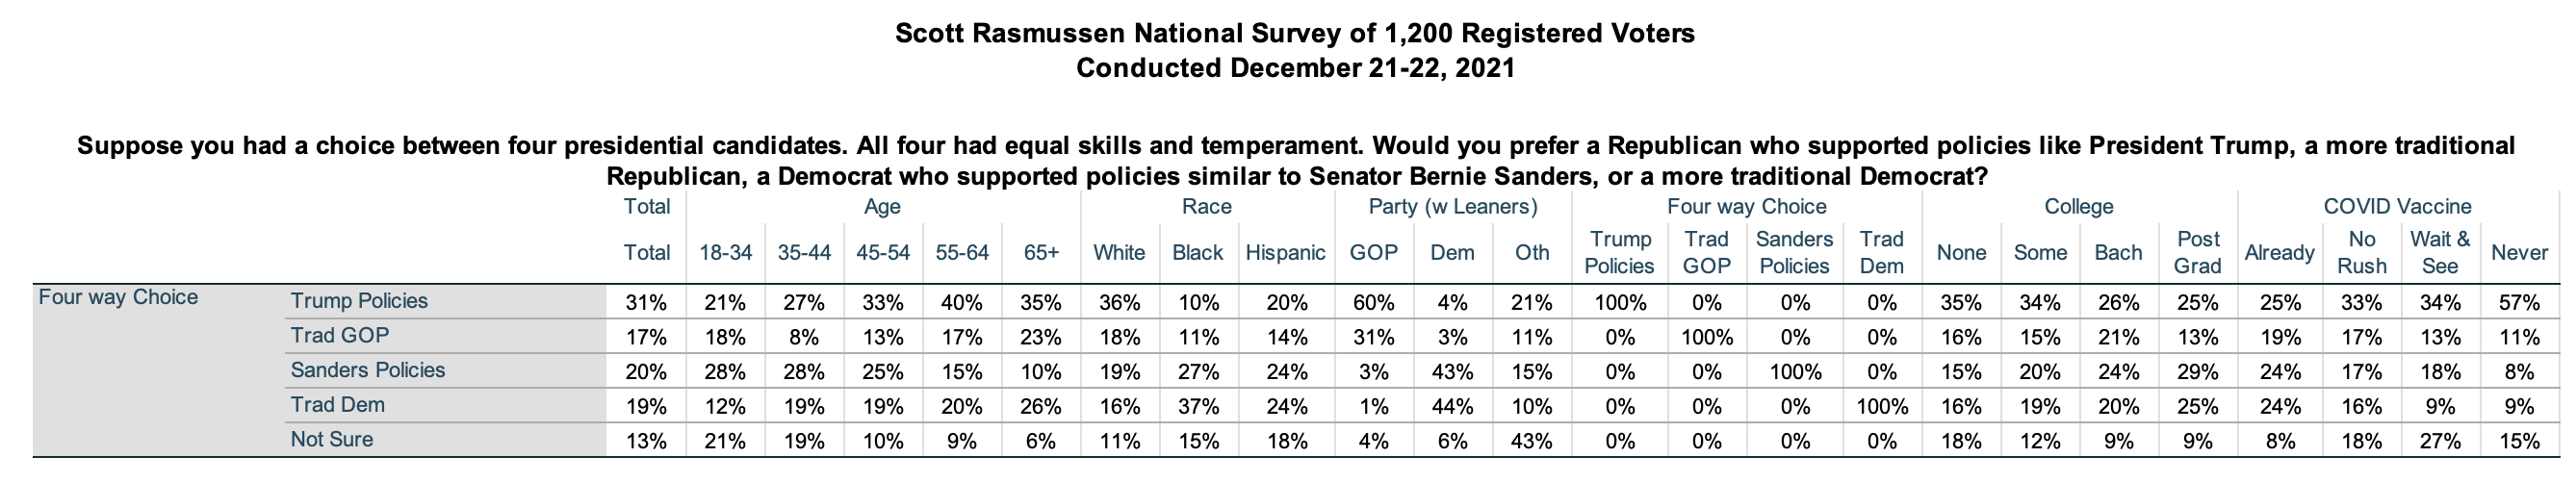
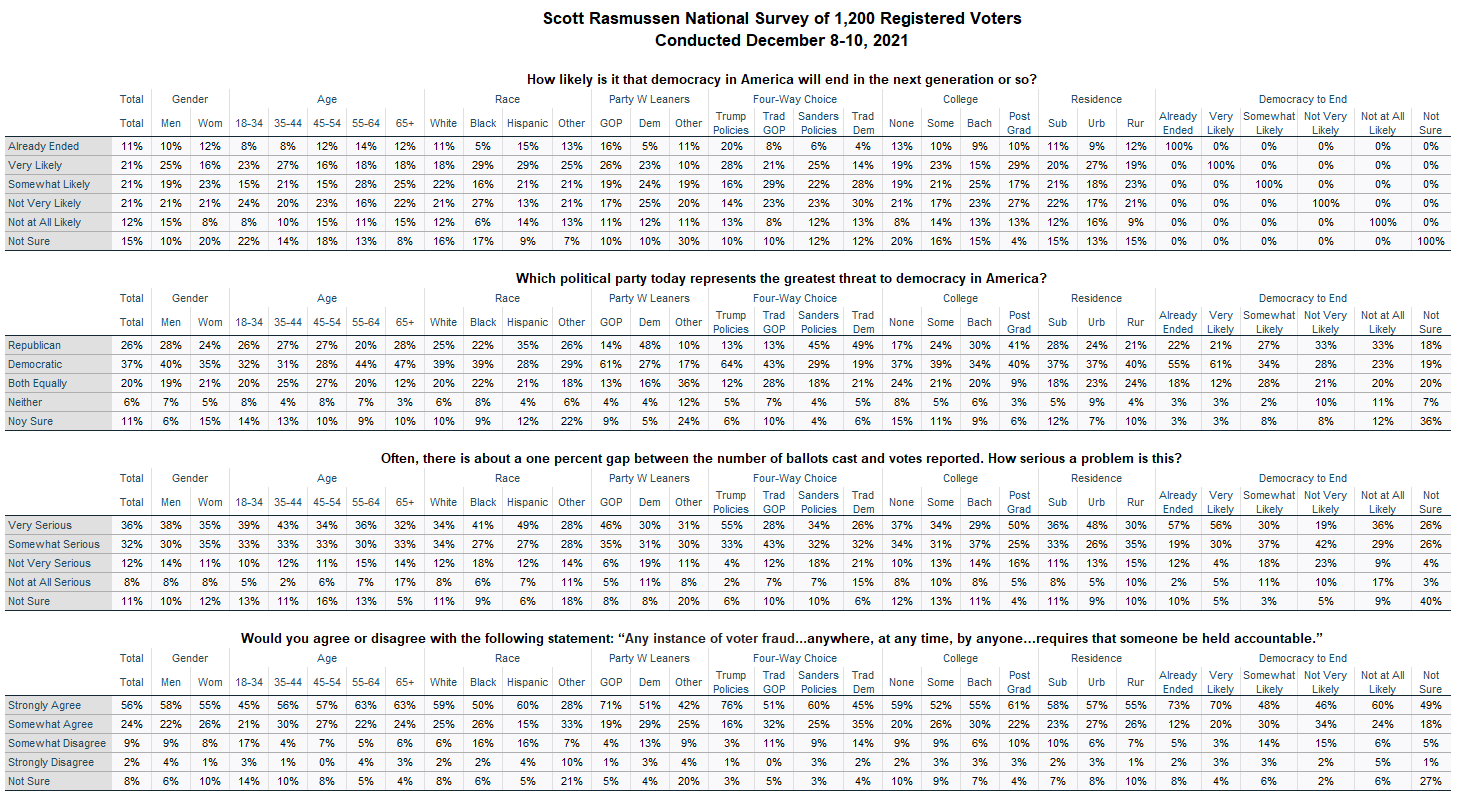
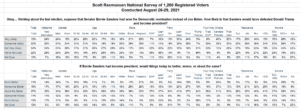
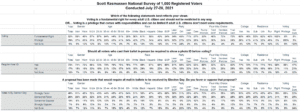
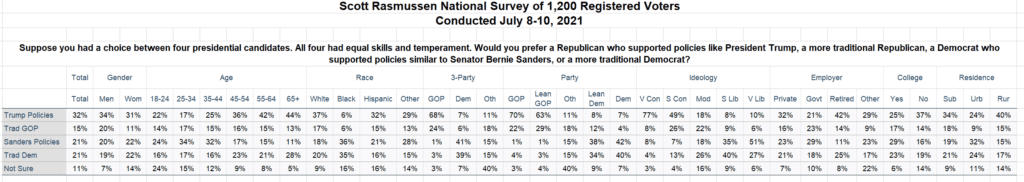
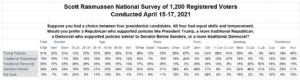
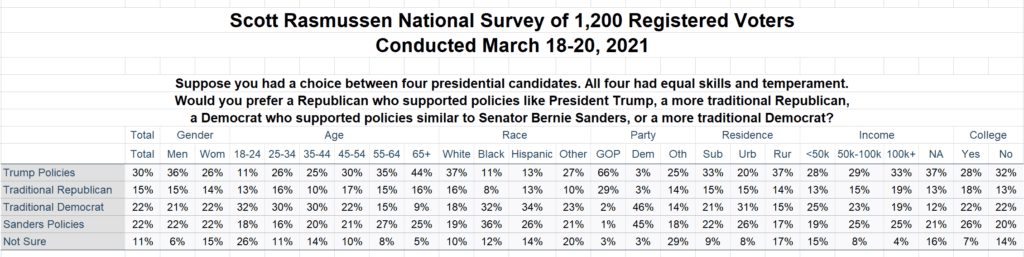
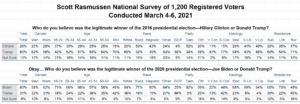
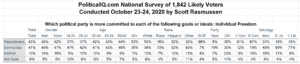
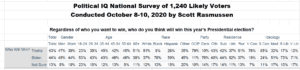
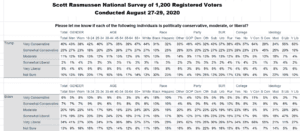
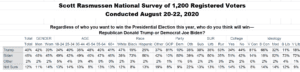
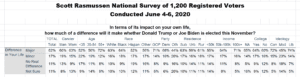
Given a choice between four presidential candidates with equal skills and temperament. 32% would prefer a Republican who supported policies like President Trump; 23% would favor a traditional Democrat; 18% are looking for a Democrat who supported policies similar to Senator Bernie Sanders; and, 15% are ready to support a traditional Republican?

Other recent survey data showed that 84% of voters believe public schools should teach the truth about slavery. At the same time,  81% believe public schools should teach that America was founded on the ideals of freedom, equality, and self-governance.

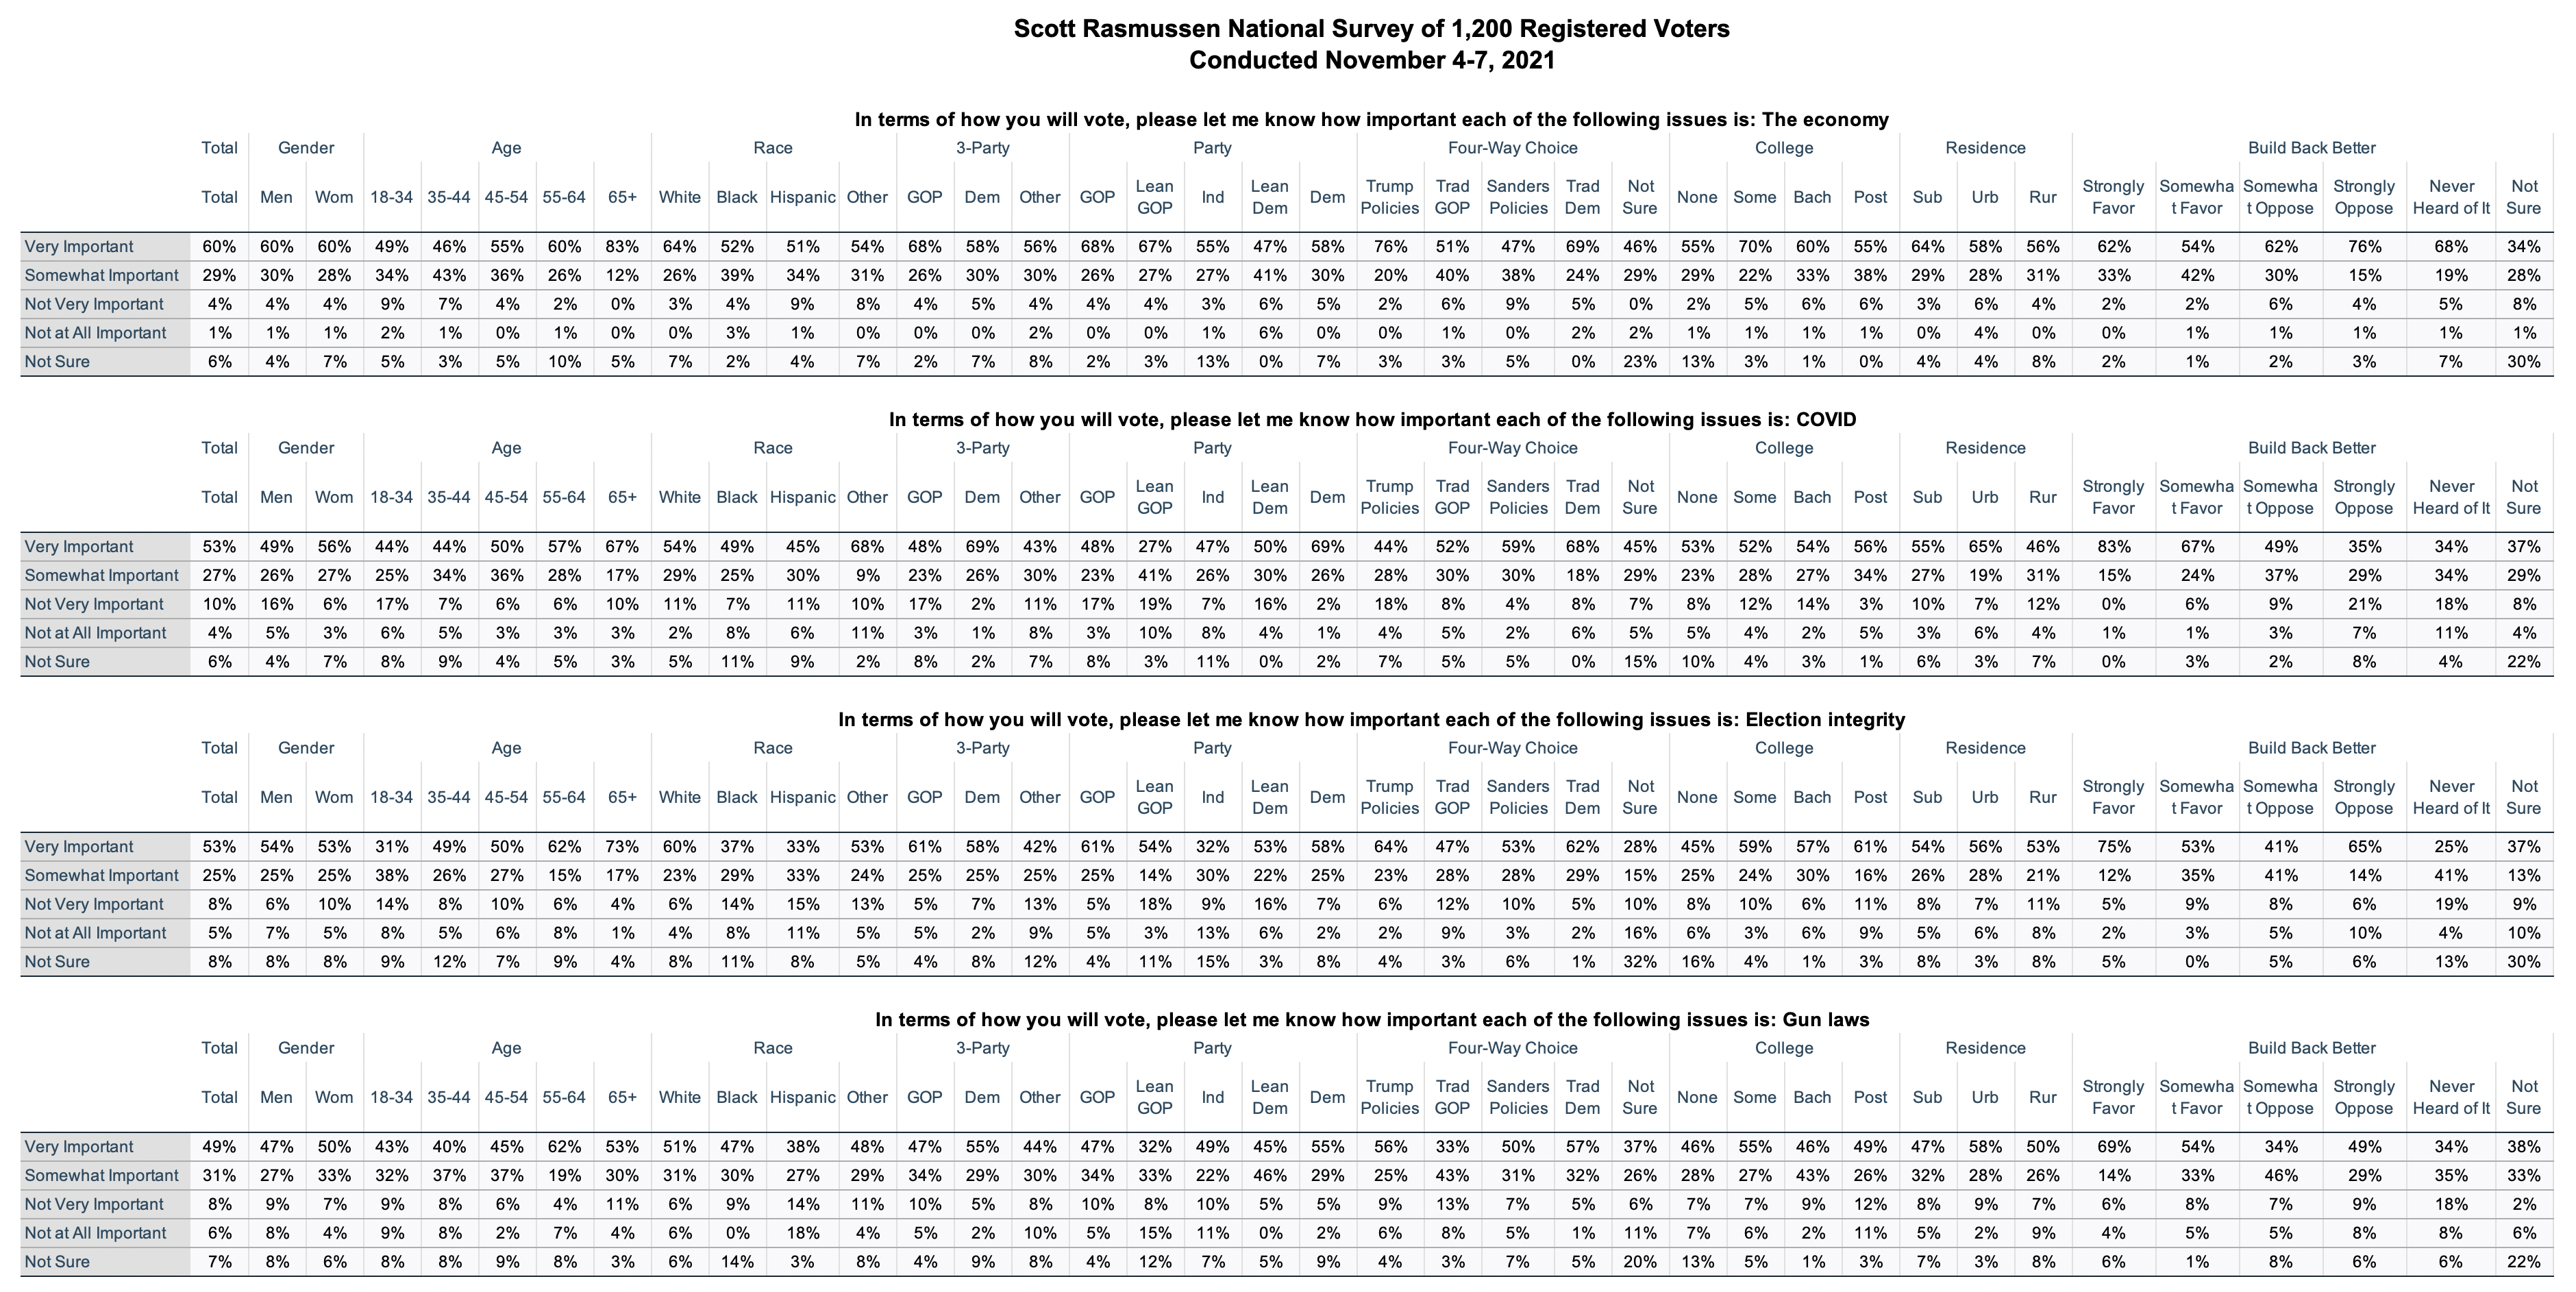
Fifty-three percent (53%) of voters believe the loss of educational opportunities from shutting down schools is a bigger threat to children than the possibility of getting COVID. A Scott Rasmussen national survey found that 31% disagree and believe COVID is the bigger threat.

When fighting the COVID pandemic, 54% of voters believe the focus should be on balancing health care concerns with social, lifestyle, and economic concerns. Thirty-four percent (34%) disagree and believe it is more important to stop COVID at all costs. Republicans and Independents tend to believe a balanced approach is best. Democrats are evenly divided.

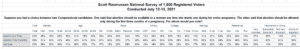
Seventy-one percent (71%) of voters believe parents should play a significant role in the curriculum development process. Twenty-three percent (23%) disagree and 7% are not sure.

Forty-nine percent (49%) believe that parents currently have too little control over the process while 11% believe they have too much control.

SIGN UP to receive Scott’s free email newsletter.

CHECK OUT Scott’s latest polls.

Note: Neither Scott Rasmussen, ScottRasmussen.com, nor RMG Research, Inc. have any affiliation with Rasmussen Reports. While Scott Rasmussen founded that firm, he left more than seven years ago and has had no involvement since that time.

Question 1:

If the election for Congress were held today, would you vote for the Republican from your district, or the Democrat from your district?

42%    Republican

40%    Democrat

8%    Other

10%    Not sure

Question 2:

Suppose you had a choice between four presidential candidates. All four had equal skills and temperament. Would you prefer a Republican who supported policies like President Trump, a more traditional Republican, a Democrat who supported policies similar to Senator Bernie Sanders, or a more traditional Democrat?

32%    A Republican supporting Trump’s policies

15%    A more traditional Republican

18%    A Democrat supporting Sanders’ policies

23%    A more traditional Democrat

12%    Not sure

Methodology

The survey of 1,000 Registered Voters was conducted online by Scott Rasmussen on January 3-4, 2022. Field work for the survey was conducted by RMG Research, Inc. Certain quotas were applied, and the sample was lightly weighted by geography, gender, age, race, education, internet usage, and political party to reasonably reflect the nation’s population of Registered Voters. Other variables were reviewed to ensure that the final sample is representative of that population.

The margin of sampling error for the full sample is +/- 3.1 percentage points.

Posted in Poll Results | Tagged , , ,

Scott's Newsletter
Sign up for Scott's newsletter and get his political insight delivered right to your inbox!

57% Believe Biden Legitimately Won in 2020; 61% Believe Trump Legitimately Won in 2016; 55% Believe Both Sides Would Steal Election if They Could

Fifty-seven percent (57%) of voters believe that Joe Biden was legitimately elected president in 2020. A Scott Rasmussen national survey found that a similar number –61%–believe Donald Trump was legitimately elected president in 2016. Just 26% of voters believe the proper winner was declared in each of those elections.

Fifty-five percent (55%) of voters believe activists and politicians in both political parties would steal an election if they could get away with it. Thirty-three percent (33%) disagree.

Most Republicans and Independents believe both sides would steal an election if they could. Democrats are evenly divided on the question.

Data released earlier showed that just 13% of voters have a favorable opinion of those who broke into the U.S. Capitol on January 6, 2021. A Scott Rasmussen national survey found that 77% have an unfavorable view.

Among those who prefer policies advocated by former President Trump, just 19% have a favorable opinion of those who broke into the Capitol. Sixty-one percent (61%) offer an unfavorable view.

SIGN UP to receive Scott’s free email newsletter.

CHECK OUT Scott’s latest polls.

Note: Neither Scott Rasmussen, ScottRasmussen.com, nor RMG Research, Inc. have any affiliation with Rasmussen Reports. While Scott Rasmussen founded that firm, he left more than seven years ago and has had no involvement since that time.

Question 1:

Who do you believe was the legitimate winner of the 2016 presidential election—Hillary Clinton or Donald Trump?

24%    Hillary Clinton

61%    Donald Trump

15%    Not sure

Question 2:

Okay… Who do you believe was the legitimate winner of the 2020 presidential election—Joe Biden or Donald Trump?

57%    Joe Biden

31%    Donald Trump

12%    Not sure

Question 3:

Do you agree or disagree with the following statement: “Political activists and candidates in both political parties are willing to steal an election if they can get away with it.”

25%    Strongly agree

30%    Somewhat agree

17%    Somewhat disagree

16%    Strongly disagree

12%    Not sure

Methodology

The survey of 1,000 Registered Voters was conducted online by Scott Rasmussen on January 3-4, 2022. Field work for the survey was conducted by RMG Research, Inc. Certain quotas were applied, and the sample was lightly weighted by geography, gender, age, race, education, internet usage, and political party to reasonably reflect the nation’s population of Registered Voters. Other variables were reviewed to ensure that the final sample is representative of that population.

Posted in Poll Results | Tagged ,

Scott's Newsletter
Sign up for Scott's newsletter and get his political insight delivered right to your inbox!

Voters Still Prefer Trump-like Policies More than Sanders Approach or Traditional R’s and D’s

Given a choice between four presidential candidates with equal skills and temperament, 31% would prefer a Republican who supported policies like those of President Trump. A Scott Rasmussen national survey found that 20% would prefer a Democrat who supported policies similar to Senator Bernie Sanders, 19% favor a more traditional Democrat, and 17% a more traditional Republican,

It’s important to remember that the question focused on the policy preference assuming that the candidates had equal skills and temperament. As a result, it cannot be assumed that someone who supports policies like those of Trump or Sanders would automatically support Trump or Sanders as a candidate.

We have been asking this question regularly since last October. Despite  everything that has happened since, these attitudes have remained broadly consistent. The current results are similar to those reported last July and April. On the Republican side, the number preferring Trump-like policies is consistently two to three times as large as the number favoring traditional GOP policies. On the other hand, the two wings of the Democratic party are always just about evenly divided.

However, the current numbers show 48% of voters favoring one of the Republican leaning options while 39% prefer a Democratic leaning set of policies. Prior to the 2020 Election, the parties were evenly divided on this measure.

The shift away from the Democrats is consistent with the decline in the president’s approval ratings and the growing GOP edge on the Generic Congressional Ballot.

SIGN UP to receive Scott’s free email newsletter.

CHECK OUT Scott’s latest polls.

Note: Neither Scott Rasmussen, ScottRasmussen.com, nor RMG Research, Inc. have any affiliation with Rasmussen Reports. While Scott Rasmussen founded that firm, he left more than seven years ago and has had no involvement since that time.

Question:

Suppose you had a choice between four presidential candidates. All four had equal skills and temperament. Would you prefer a Republican who supported policies like President Trump, a more traditional Republican, a Democrat who supported policies similar to Senator Bernie Sanders, or a more traditional Democrat?

31%    A Republican supporting Trump’s policies

17%     A more traditional Republican

20%    A Democrat supporting Sanders’ policies

19%    A more traditional Democrat

13%    Not sure

Methodology

The survey of 1,200 Registered Voters was conducted online by Scott Rasmussen on December 21-22, 2021. Field work for the survey was conducted by RMG Research, Inc. Certain quotas were applied, and the sample was lightly weighted by geography, gender, age, race, education, internet usage, and political party to reasonably reflect the nation’s population of Registered Voters. Other variables were reviewed to ensure that the final sample is representative of that population.

Posted in Poll Results | Tagged , ,

Scott's Newsletter
Sign up for Scott's newsletter and get his political insight delivered right to your inbox!

Biden Approval Underwater on 6 Key Issues; Weakest on Immigration, Taxes & Government Spending

On each of six key issues measured, more voters disapprove of President Biden’s performance.

A Scott Rasmussen national survey found that Biden’s weakest ratings are on the topic of immigration where just 31% approve and 57% disapprove (net rating of -26 points). Forty-eight percent (48%) of voters believe the Biden Administration is making it too easy for illegal immigrants to enter the country. Just 10% disagree.

Most voters (55%) believe drug cartels have more control of the southern border than the U.S. government.

On the topic of government spending and taxes, just 36% approve and 54% disapprove (net rating -18). That may partly reflect the fact that his Build Back Better plan had a number of extraordinarily unpopular items. Additionally, most voters share Senator Joe Manchin’s concerns and believe the president’s plan would have made inflation worse.

On the economy, the president has a net rating of -11 (41% approve while 52% disapprove). He does a little better on national security (40% approve, 48% disapprove, net rating of -8).

His best marks were earned on COVID (45% approve, 48% disapprove, net rating of -3) and Health care (44% approve, 45% disapprove, net rating of -8).

On all six issues, the number who Strongly Disapprove is significantly higher than the number who Strongly Approve.

SIGN UP to receive Scott’s free email newsletter.

CHECK OUT Scott’s latest polls.

Note: Neither Scott Rasmussen, ScottRasmussen.com, nor RMG Research, Inc. have any affiliation with Rasmussen Reports. While Scott Rasmussen founded that firm, he left more than seven years ago and has had no involvement since that time.

Question:

Please let me know if you approve or disapprove of the way President Biden is handling each of the following issues:

The economy

18%    Strongly approve

23%    Somewhat approve

18%    Somewhat disapprove

34%    Strongly disapprove

8%    Not sure

COVID

24%    Strongly approve

21%    Somewhat approve

18%    Somewhat disapprove

30%    Strongly disapprove

6%    Not sure

Immigration

14%    Strongly approve

17%    Somewhat approve

18%    Somewhat disapprove

39%    Strongly disapprove

11%    Not sure

National security

18%    Strongly approve

22%    Somewhat approve

18%    Somewhat disapprove

30%    Strongly disapprove

13%    Not sure

Health care

20%    Strongly approve

24%    Somewhat approve

18%    Somewhat disapprove

27%    Strongly disapprove

11%    Not sure

Taxes and government spending

16%    Strongly approve

20%    Somewhat approve

14%    Somewhat disapprove

40%    Strongly disapprove

10%    Not sure

Methodology

The survey of 1,200 Registered Voters was conducted online by Scott Rasmussen on December 8-10, 2021. Field work for the survey was conducted by RMG Research, Inc. Certain quotas were applied, and the sample was lightly weighted by geography, gender, age, race, education, internet usage, and political party to reasonably reflect the nation’s population of Registered Voters. Other variables were reviewed to ensure that the final sample is representative of that population.

Posted in Poll Results | Tagged ,

Scott's Newsletter
Sign up for Scott's newsletter and get his political insight delivered right to your inbox!

62% Oppose Non-Citizens Voting in Local Elections; 27% Favor the Idea

New York City recently voted to allow approximately 800,000 non-citizens to vote in municipal elections. A Scott Rasmussen national survey found that just 27% favor allowing non-citizens to vote in local elections. Sixty-two percent (62%) are opposed.

Those totals include 10% who Strongly Favor the idea and 47% who are Strongly Opposed.

Republicans oppose the idea by an 84% to 12% margins. Independents are opposed by a 53% to 23% margin. Democrats are evenly divided.

White voters oppose the idea by a 68% to 22% margin. Black and Hispanic voters are evenly divided.

The survey also found that 56% would favor a new national law preventing non-citizens from voting in any local, state, or federal elections. Thirty-one percent (31%) are opposed to such a law.

SIGN UP to receive Scott’s free email newsletter.

CHECK OUT Scott’s latest polls.

Note: Neither Scott Rasmussen, ScottRasmussen.com, nor RMG Research, Inc. have any affiliation with Rasmussen Reports. While Scott Rasmussen founded that firm, he left more than seven years ago and has had no involvement since that time.

Question 1:

New York City recently voted to allow approximately 800,000 non-citizens to vote in municipal elections. Do you favor or oppose allowing non-citizens to vote in local elections?

10%    Strongly favor

17%    Somewhat favor

15%    Somewhat oppose

47%    Strongly oppose

11%    Not sure

Question 2:

Would you favor or oppose a new national law preventing non-citizens from voting in any local, state, or federal elections?

41%    Strongly favor

15%    Somewhat favor

15%    Somewhat oppose

16%    Strongly oppose

12%    Not sure

Methodology

The survey of 1,200 Registered Voters was conducted online by Scott Rasmussen on December 16-17, 2021. Field work for the survey was conducted by RMG Research, Inc. Certain quotas were applied, and the sample was lightly weighted by geography, gender, age, race, education, internet usage, and political party to reasonably reflect the nation’s population of Registered Voters. Other variables were reviewed to ensure that the final sample is representative of that population.

Posted in Poll Results | Tagged ,

Scott's Newsletter
Sign up for Scott's newsletter and get his political insight delivered right to your inbox!

Generic Ballot: Republicans 44% Democrats 38%

Republicans have opened a six point lead on the Generic Congressional Ballot. The latest Scott Rasmussen national survey found that 44% of Registered Voters would currently vote for the Republican from their district while 38% would vote for the Democrat. Nine percent (9%) would not vote and 10% are not sure.

This is the first Scott Rasmussen survey of the 2022 cycle to include “leaners.” Those are people who initially express no preference for either party. However, on a follow-up question, they indicate a preference if they had to make a choice right now.

Without leaners, the Republican advantage on this latest survey was three percentage points (38% to 35). That’s unchanged from late November, but up two since late October.

The trend throughout 2022 has clearly favored the GOP. In Scott Rasmussen’s April survey, Democrats enjoyed a four-point advantage. However, President Biden’s party has not led since September.

This trend is consistent with the ongoing series of party affiliation data tracked by Gallup. In April, Democrats had a five-point advantage. The latest numbers, from November, show a nine-point swing in favor of the GOP. Currently, 31% of adults identify with the Republicans while 27% consider themselves Democrats.

The decline in support for Democrats likely has many causes. In terms of legislation, the president’s Build Back Better plan is weighed down by a large number of extraordinarily unpopular provisions. Additionally, Democrats are seen as a bigger threat to democracy than Republicans. In their push for election reform, Democrats have sought legislation to outlaw three election reforms that are supported by more than 80 percent of voters.

Beyond specific legislation, there are many broader concerns. Most voters recognize that, compared to pre-pandemic numbers, there are far fewer Americans with a job these days. Politically, this is a very challenging issue for Democrats. Two-thirds of voters say economic issues are more important than cultural issues. Yet only 37% believe that Democratic politicians and activists are primarily interested in economic issues.

SIGN UP to receive Scott’s free email newsletter.

CHECK OUT Scott’s latest polls.

Note: Neither Scott Rasmussen, ScottRasmussen.com, nor RMG Research, Inc. have any affiliation with Rasmussen Reports. While Scott Rasmussen founded that firm, he left more than seven years ago and has had no involvement since that time.

Question:

If the election for Congress were held today, would you vote for the Republican from your district, or the Democrat from your district? [If “Other”/”Not sure”] Okay, if you had to make a choice right now, would you be more likely to vote for the Republican or the Democrat from your district?

44%    Republican

38%    Democrat

9%    Would not vote

10%    Not sure

Methodology

The survey of 1,200 Registered Voters was conducted online by Scott Rasmussen on December 8-10, 2021. Field work for the survey was conducted by RMG Research, Inc. Certain quotas were applied, and the sample was lightly weighted by geography, gender, age, race, education, internet usage, and political party to reasonably reflect the nation’s population of Registered Voters. Other variables were reviewed to ensure that the final sample is representative of that population.


Posted in Uncategorized | Tagged ,

Scott's Newsletter
Sign up for Scott's newsletter and get his political insight delivered right to your inbox!

32% Believe Democracy Very Likely to End Within Generation; Republicans Are More Worried Than Democrats; Dems Seen As Bigger Threat

Thirty-two percent (32%) of voters think it’s Very Likely that democracy in America will end in the next generation or so. A Scott Rasmussen national survey found that total includes 11% who believe it has already ended.

Another 21% say democracy is somewhat likely to end over the next generation, 33% say it’s not likely to happen, and 15% are not sure.

Republicans are significantly more worried about democracy ending than Democrats. Forty-two percent (42%) of GOP voters think it is Very Likely to end over the next generation. Just 28% of those in President Biden’s party share that view.

Thirty-seven percent (37%) of all voters see Democrats as a bigger threat to democracy than Republicans. Twenty-six percent (26%) see Republicans as the bigger threat while 20% think the two parties represent an equal threat to democracy.

One reason a plurality of voters see Democrats as the bigger threat may be that they are actively promoting legislation to outlaw three election reforms that are supported by more than 80 percent of voters.  The effort by Congressional Democrats to outlaw photo ID requirements is especially significant.

But the challenges run much deeper than simply election laws. Data released earlier showed that 55% of voters believe letting government bureaucrats set rules without approval of Congress or voters is a major threat to democracy. Rather than a public service responding to voters, 73% see the federal government is a special interest group that looks out primarily for its own interests. Forty-five percent (45%) see the January 6 assault on the U.S. Capitol as a major threat to democracy.

Fifty-eight percent (58%) of voters are confident that American elections are conducted in a manner that ensures all votes are counted and that the proper winners are declared. Most Democrats (54%) continue to believe that Hillary Clinton was the legitimate winner of the 2016 presidential election. Most Republicans (63%) believe that Donald Trump was the legitimate winner in 2020.

The latest survey also found 68% believe even small discrepancies in vote counts represent a serious problem. Eighty percent (80%) agree that “Any instance of voter fraud…anywhere, at any time, by anyone…requires that someone be held accountable.”

SIGN UP to receive Scott’s free email newsletter.

CHECK OUT Scott’s latest polls.

Note: Neither Scott Rasmussen, ScottRasmussen.com, nor RMG Research, Inc. have any affiliation with Rasmussen Reports. While Scott Rasmussen founded that firm, he left more than seven years ago and has had no involvement since that time.

Question 1:

How likely is it that democracy in America will end in the next generation or so?

11%    It has already ended

21%    Very likely

21%    Somewhat likely

21%    Not very likely

12%    Not at all likely

15%    Not sure

Question 2:

Which political party today represents the greatest threat to democracy in America?

26%    Republican

37%    Democratic

20%    Both equally

6%    Neither 

11%    Not sure

Question 3:

Often, there is about a one percent gap between the number of ballots cast and votes reported. How serious a problem is this?

36%    Very serious

32%    Somewhat serious

12%    Not very serious

8%    Not at all serious

11%    Not sure

Question 4:

Would you agree or disagree with the following statement: “Any instance of voter fraud…anywhere, at any time, by anyone…requires that someone be held accountable.”

56%    Strongly agree

24%    Somewhat agree

9%    Somewhat disagree

2%    Strongly disagree

8%    Not sure

Methodology

The survey of 1,200 Registered Voters was conducted online by Scott Rasmussen on December 8-10, 2021. Field work for the survey was conducted by RMG Research, Inc. Certain quotas were applied, and the sample was lightly weighted by geography, gender, age, race, education, internet usage, and political party to reasonably reflect the nation’s population of Registered Voters. Other variables were reviewed to ensure that the final sample is representative of that population.


Posted in Poll Results | Tagged ,

Scott's Newsletter
Sign up for Scott's newsletter and get his political insight delivered right to your inbox!

Individual Freedom Tops List of Issues Before Supreme Court Followed By Gun Laws, Religious Liberty, Limiting the Power of Government, and Abortion

Sixty-eight percent (68%) of voters say that individual freedom is Very Important in terms of how they vote. That’s the highest rating among seven broad issues being considered by the Supreme Court. A Scott Rasmussen national survey found that 63% rated gun laws as Very Important, 58% who say Religious Liberty is Very Important and 55% say the same about limiting the power of government. Abortion is seen as Very Important by 49%, Death Penalty Issues by 41%, and Transgender Rights by 31%.

For Republicans, the top three issues are Individual Freedom, Limiting the Power of Government and Religious Liberty.

For Democrats, the top three are Gun Laws, Individual Freedom, and Religious Liberty.

For Independents, the top issues are Individual Freedom, Gun Laws, and Religious Liberty.


SIGN UP to receive Scott’s free email newsletter.

CHECK OUT Scott’s latest polls.

Note: Neither Scott Rasmussen, ScottRasmussen.com, nor RMG Research, Inc. have any affiliation with Rasmussen Reports. While Scott Rasmussen founded that firm, he left more than seven years ago and has had no involvement since that time.

Question:

In terms of how you will vote, how important are each of the following issues?

Abortion

49%    Very important

26%    Somewhat important

12%    Not very important

6%    Not at all important

7%    Not sure

Gun laws

63%    Very important

22%    Somewhat important

6%    Not very important

4%    Not at all important

4%    Not sure

Limiting the power of government

55%    Very important

27%    Somewhat important

9%    Not very important

3%    Not at all important

6%    Not sure

Transgender rights

31%    Very important

23%    Somewhat important

17%    Not very important

20%    Not at all important

7%    Not sure

Individual rights

68%    Very important

19%    Somewhat important

5%    Not very important

2%    Not at all important

6%    Not sure

Religious liberty

58%    Very important

24%   Somewhat important

8%    Not very important

5%    Not at all important

5%    Not sure

Death penalty

41%    Very important

32%    Somewhat important

13%    Not very important

6%    Not at all important

8%    Not sure

Methodology

The survey of 1,200 Registered Voters was conducted online by Scott Rasmussen on December 6-8, 2021. Field work for the survey was conducted by RMG Research, Inc. Certain quotas were applied, and the sample was lightly weighted by geography, gender, age, race, education, internet usage, and political party to reasonably reflect the nation’s population of Registered Voters. Other variables were reviewed to ensure that the final sample is representative of that population.

Posted in Poll Results | Tagged , , , , , , ,

Scott's Newsletter
Sign up for Scott's newsletter and get his political insight delivered right to your inbox!

60% Say Economy Very Important Voting Issue; 53% Say Same About COVID and Election Integrity

In terms of how they will vote, 60% of voters say the economy is Very Important. A Scott Rasmussen national survey found that 53% say the same about COVID and Election integrity.

Lagging behind in voter priorities are Gun Laws (49%), Climate Change (45%), Economic Inequality (39%), and the January 6 assault on the U.S. Capitol (38%).

Among these issues, COVID, Climate Change, and the events of January 6 are most important for Democrats.

For Republicans, the top issues are the Economy, Election Integrity, and COVID.

Among Independent voters, the Economy comes out on top. It is followed by Gun Laws, COVID, and Climate Change.


SIGN UP to receive Scott’s free email newsletter.

CHECK OUT Scott’s latest polls.

Note: Neither Scott Rasmussen, ScottRasmussen.com, nor RMG Research, Inc. have any affiliation with Rasmussen Reports. While Scott Rasmussen founded that firm, he left more than seven years ago and has had no involvement since that time.

Question:

In terms of how you will vote, please let me know how important each of the following issues is:

The economy

60%    Very important

29%    Somewhat important

4%    Not very important

1%    Not at all important

6%    Not sure

COVID

53%    Very important

27%    Somewhat important

10%    Not very important

4%    Not at all important

6%    Not sure

Election integrity

53%    Very important

25%    Somewhat important

8%    Not very important

5%    Not at all important

8%    Not sure

Gun laws

49%    Very important

31%    Somewhat important

8%    Not very important

6%    Not at all important

7%     Not sure

Climate change

45%    Very important

30%    Somewhat important

9%    Not very important

10%    Not at all important

5%    Not sure

The January 6th assault on U.S. Capitol

38%    Very important

25%    Somewhat important

12%    Not very important

13%    Not at all important

11%    Not sure

Economic inequality

39%    Very important

33%    Somewhat important

11%    Not very important

8%    Not at all important

7%    Not sure

Methodology

The survey of 1,200 Registered Voters was conducted online by Scott Rasmussen on November 4-7, 2021. Field work for the survey was conducted by RMG Research, Inc. Certain quotas were applied, and the sample was lightly weighted by geography, gender, age, race, education, internet usage, and political party to reasonably reflect the nation’s population of Registered Voters. Other variables were reviewed to ensure that the final sample is representative of that population.

Posted in Poll Results | Tagged

Scott's Newsletter
Sign up for Scott's newsletter and get his political insight delivered right to your inbox!

Generic Ballot: GOP 41% Dems 40%

If the midterm elections were held today,  41% of Registered Voters would vote for the Republican from their Congressional District while 40% would vote for the  Democrat. Those numbers are unchanged since mid-October. A Scott Rasmussen national survey found that 5% would vote for some other candidate while 13% are not sure.

The survey was conducted just prior to last week’s elections in Virginia. The survey is of Registered Voters rather than Likely Voters. In last week’s elections, conservative and Republican voters were more likely than others to cast a ballot. If that enthusiasm advantage continues into the midterm elections, the numbers suggest the GOP would win a sizable victory in 2022.

A Scott Rasmussen Election Night survey in Virginia showed that 81% of Virginia voters believe photo IDs should be required for voting; 71% of Youngkin voters believe you can support Trump policies without supporting Trump while 61% of McAuliffe voters disagree; and, 83% of Virginia voters agree that “America was founded on the ideals of freedom, equality, and self-governance.”

National voter surveys found that four key election reforms are supported by more than 80% of voters. These include requirements to remove people who have died or moved from voter registration lists; requiring all voters to show photo ID before casting a ballot; wanting all ballots received by Election Day; and, having all voting machines made in the United States.

On another topic, 40% of voters believe the worst of the pandemic is behind us while 30% believe the worst is yet to come. Optimism on this front has been growing over the past month.

Seventy-five percent (75%) of voters are close to resuming their normal life in terms of going out socially, traveling, and interacting with others in person. The hesitance of those who have been vaccinated to resume normal activities may be one factor driving economic challenges.

Currently 45% of voters believe the U.S. is in a recession. Large majorities have experienced sharp inflation and supply chain issues.

SIGN UP to receive Scott’s free email newsletter.

CHECK OUT Scott’s latest polls.

Note: Neither Scott Rasmussen, ScottRasmussen.com, nor RMG Research, Inc. have any affiliation with Rasmussen Reports. While Scott Rasmussen founded that firm, he left more than seven years ago and has had no involvement since that time.

Question:

If elections for Congress were held today, would you vote for the Republican from your district, or the Democrat from your district?

41%    Republican

40%    Democrat

5%    Other

13%    Not sure

Methodology

The survey of 1,200 Registered Voters was conducted online by Scott Rasmussen on October 28-30, 2021. Field work for the survey was conducted by RMG Research, Inc. Certain quotas were applied, and the sample was lightly weighted by geography, gender, age, race, education, internet usage, and political party to reasonably reflect the nation’s population of Registered Voters. Other variables were reviewed to ensure that the final sample is representative of that population.

Posted in Poll Results | Tagged ,

Scott's Newsletter
Sign up for Scott's newsletter and get his political insight delivered right to your inbox!

81% Want All Voting Machines Made in US

Eighty-one percent (81%) of voters want all voting machines made in the United States. A Scott Rasmussen national survey found that just 8% are opposed and 11% are not sure.

The survey also found that 88% want to see a requirement for states to remove people who have died or moved from voter registration lists; 85% want all voters to show photo ID before casting a ballot, and 82% want all ballots to be received by Election Day.

SIGN UP to receive Scott’s free email newsletter.

CHECK OUT Scott’s latest polls.

Note: Neither Scott Rasmussen, ScottRasmussen.com, nor RMG Research, Inc. have any affiliation with Rasmussen Reports. While Scott Rasmussen founded that firm, he left more than seven years ago and has had no involvement since that time.

Question 1:

Please let me know if you favor or oppose each of the following:

Requiring voters to show photo ID before casting a ballot

65%    Strongly favor

20%    Somewhat favor

8%    Somewhat oppose

4%    Strongly oppose

4%    Not sure

Requiring all mail-in ballots to be received by Election Day

61%    Strongly favor

21%    Somewhat favor

7%    Somewhat oppose

6%    Strongly oppose

5%    Not sure

Requiring states to remove people who have died or moved from the voter registration lists

73%    Strongly favor

15%    Somewhat favor

6%    Somewhat oppose

2%    Strongly oppose

5%    Not sure

Requiring all voting machines to be made in the United States

63%    Strongly favor

18%    Somewhat favor

4%    Somewhat oppose

4%    Strongly oppose

11%    Not sure

Methodology

The survey of 1,200 Registered Voters was conducted online by Scott Rasmussen on October 25-27, 2021. Field work for the survey was conducted by RMG Research, Inc. Certain quotas were applied, and the sample was lightly weighted by geography, gender, age, race, education, internet usage, and political party to reasonably reflect the nation’s population of Registered Voters. Other variables were reviewed to ensure that the final sample is representative of that population.

Posted in Poll Results | Tagged ,

Scott's Newsletter
Sign up for Scott's newsletter and get his political insight delivered right to your inbox!

Generic Ballot: Republicans 41% Democrats 40%

If the midterm elections were held today,  41% of Registered Voters would vote for the Republican from their Congressional District while 40% would vote for the  Democrat. A Scott Rasmussen national survey found that 6% would vote for some other candidate while 13% are not sure.

Those numbers are little changed from a month ago. However, it is the first time that Republicans have led by even a statistically insignificant margin all year. Six months ago, Democrats had a four-point advantage.

One challenge facing Democrats at the moment is growing pessimism about the economy. Twenty-five percent (25%) of voters nationwide say their own personal finances are getting better but 33% say they are getting worse.

Additionally, 63% of voters have experienced backorders, delays, and shortages.

Another challenge revolves around the call for vaccine mandates. Survey data suggest it is quite likely that many people will be vaccinated against their will. Forty-three percent (43%) say that’s a good thing while another 43% say it’s bad.

By a 55% to 30% margin, those who have already been vaccinated say it’s good to vaccinate others against their will. However, among those who are in no rush to get vaccinated or will never get vaccinated, just 6% say it’s a good thing while 85% say it’s bad. This suggests the possibility of a significant political backlash.

On a different topic, 64% of voters agree that “Just about all positive change in America begins outside of America’s political system.

Finally, 83% of voters believe making it easier to vote and harder to cheat should be the goal of election reform. At this point in time, 51% say making it harder to cheat is the higher priority while 37% take the opposite view.

SIGN UP to receive Scott’s free email newsletter.

CHECK OUT Scott’s latest polls.

Note: Neither Scott Rasmussen, ScottRasmussen.com, nor RMG Research, Inc. have any affiliation with Rasmussen Reports. While Scott Rasmussen founded that firm, he left more than seven years ago and has had no involvement since that time.

Methodology

The survey of 1,200 Registered Voters was conducted online by Scott Rasmussen on October 11-13, 2021. Field work for the survey was conducted by RMG Research, Inc. Certain quotas were applied, and the sample was lightly weighted by geography, gender, age, race, education, internet usage, and political party to reasonably reflect the nation’s population of Registered Voters. Other variables were reviewed to ensure that the final sample is representative of that population.

The margin of sampling error for the full sample is +/- 2.8 percentage points.

Posted in Uncategorized | Tagged

Scott's Newsletter
Sign up for Scott's newsletter and get his political insight delivered right to your inbox!

58% Have Confidence In American Elections

Fifty-eight percent (58%) of voters are confident that American elections are conducted in a manner that ensures all votes are counted and that the proper winners are declared. A Scott Rasmussen national survey found that 35% lack such confidence and 7% are not sure.

The totals include 31% who are Very Confident and 18% who are Not at All Confident.

As has been true for decades, the party winning the White House has greater confidence in the election process. Eighty-three percent (83%) of Democrats have confidence in American elections. Just 48% of Independent voters and 42% or Republicans agree.

Looking back, most Democrats (54%) continue to believe that Hillary Clinton was the legitimate winner of the 2016 presidential election. Most Republicans (63%) believe that Donald Trump was the legitimate winner in 2020.

Just 30% of voters are confident that the right person was declared president in both 2016 and 2020.

These perceptions have changed little since March.

SIGN UP to receive Scott’s free email newsletter.

CHECK OUT Scott’s latest polls.

Note: Neither Scott Rasmussen, ScottRasmussen.com, nor RMG Research, Inc. have any affiliation with Rasmussen Reports. While Scott Rasmussen founded that firm, he left more than seven years ago and has had no involvement since that time.

Methodology

The survey of 1,200 Registered Voters was conducted online by Scott Rasmussen on September 28-29, 2021. Field work for the survey was conducted by RMG Research, Inc. Certain quotas were applied, and the sample was lightly weighted by geography, gender, age, race, education, internet usage, and political party to reasonably reflect the nation’s population of Registered Voters. Other variables were reviewed to ensure that the final sample is representative of that population.

The margin of sampling error for the full sample is +/- 2.8 percentage points.

Posted in Poll Results | Tagged , , ,

Scott's Newsletter
Sign up for Scott's newsletter and get his political insight delivered right to your inbox!

Biden: 45% Approve; Strong Approval at 18%, Down 7 Over Past Week

Forty-five percent (45%) of voters nationwide now approve of the way President Biden is performing his job. That’s down three points from a week ago. A Scott Rasmussen national survey found that 48% disapprove and 6% are not sure.

Just 18% of voters Strongly Approve of the president’s performance, down seven points from a week ago and the lowest level yet measured. Thirty-four percent (34%)Strongly Disapprove.

Sixty-seven percent (67%) of voters consider the situation at the border to be a crisis and just 22% say Biden has done a good or excellent job dealing with it.

Fifty-eight percent (58%) of voters disapprove of the president’s decision to remove American troops from Afghanistan before all Americans were evacuated. Twenty-one percent (21%) give the president good marks for handling that withdrawal.

On the legislative front, voters are evenly divided when given a choice between passing or rejecting both the bi-partisan infrastructure legislation and the $3.5 trillion reconciliation package: 40% would prefer to pass both bills while 38% would like to see both rejected. Voters are also evenly divided as to whether Biden’s policies are good or bad for the middle class.

The two spending bills include some popular provisions but 77% of voters expect the final package will also include “Inappropriate” provisions inserted by lobbyists.

  • One such provision would provide tax credits of up to $50,000 for print journalists. Just 19% of voters favor that provision.
  • Another provision that may be included would require banks to notify the IRS of every transaction of $600 or more made by every American. Just 18% like that idea while 73% are opposed.

Voters also overwhelmingly believe that higher corporate tax rates will lead to higher prices for consumers.

SIGN UP to receive Scott’s free email newsletter.

CHECK OUT Scott’s latest polls.

Note: Neither Scott Rasmussen, ScottRasmussen.com, nor RMG Research, Inc. have any affiliation with Rasmussen Reports. While Scott Rasmussen founded that firm, he left more than seven years ago and has had no involvement since that time.

Methodology

The survey of 1,200 Registered Voters was conducted online by Scott Rasmussen on September 24-25, 2021. Field work for the survey was conducted by RMG Research, Inc. Certain quotas were applied, and the sample was lightly weighted by geography, gender, age, race, education, internet usage, and political party to reasonably reflect the nation’s population of Registered Voters. Other variables were reviewed to ensure that the final sample is representative of that population.

The margin of sampling error for the full sample is +/- 2.8 percentage points.

Posted in Poll Results | Tagged , ,

Scott's Newsletter
Sign up for Scott's newsletter and get his political insight delivered right to your inbox!

50% Believe Things Would Be Better Today If Trump Had Won; 39% Say Worse

Fifty percent (50%) of voters believe things would be better today if Donald Trump had won the 2020 presidential election. A Scott Rasmussen national survey found that 39% believe things would be worse and 12% who don’t think things would be all that different.

The total includes 34% who say things would be much better and 29% who say much worse.

Eighty-five percent (85%) of Republicans believe things would be better while 68% of Democrats hold the opposite view. Among Independents, 43% say better and 39% worse.

Fifty-four percent (54%) of White voters believe things would be better if Trump had won. So do 53% of Hispanic voters and 26% of Black voters.

These results may highlight some challenges resulting from President Biden’s call for a vaccine mandate. While the proposal is modestly popular overall,  26% of Black Democrats believe individuals should decide for themselves whether to get vaccinated. Additionally, 60% of Hispanic voters have a close friend or relative who will get vaccinated against their will because they can’t afford to lose their job.

President Biden has gotten very low marks for handling the situation at the southern border of the United States. On a related national security topic, most voters disapprove of the president’s decision to withdraw U.S. troops from Afghanistan before all Americans were evacuated.

Overall, a plurality of voters would prefer a candidate who supports Trump-like policies.

President Biden has had a challenging few months and his job approval ratings have slipped.

SIGN UP to receive Scott’s free email newsletter.

CHECK OUT Scott’s latest polls.

*  Suppose that Donald Trump had won the 2020 election. Would things today be better, worse, or about the same?

34%      Much better

16%      Somewhat better

10%      Somewhat worse

29%      Much worse

6%       About the same

6%       Not sure

Note: Neither Scott Rasmussen, ScottRasmussen.com, nor RMG Research, Inc. have any affiliation with Rasmussen Reports. While Scott Rasmussen founded that firm, he left more than seven years ago and has had no involvement since that time.

Methodology

The survey of 1,200 Registered Voters was conducted by Scott Rasmussen using a mixed mode approach from September 16-18, 2021. Field work for the survey was conducted by RMG Research, Inc. Most respondents were contacted online or via text while 263 were contacted using automated phone polling techniques. Online respondents were selected from a list of Registered Voters and through a process of Random Digital Engagement. Certain quotas were applied, and the sample was lightly weighted by geography, gender, age, race, education, internet usage, and political party to reasonably reflect the nation’s population of Registered Voters. Other variables were reviewed to ensure that the final sample is representative of that population.

The margin of sampling error for the full sample is +/- 2.8 percentage points.

Posted in Poll Results | Tagged , ,

Scott's Newsletter
Sign up for Scott's newsletter and get his political insight delivered right to your inbox!

Generic Congressional Ballot: GOP 40% Dems 40%

Following President Biden’s speech and new COVID mandates, the Generic Congressional Ballot remains essentially unchanged. The latest Scott Rasmussen poll shows that, if the election were held today,  40% of Registered Voters would vote for the Democrat from their Congressional District while 40% would vote for the Republican.

Those numbers are unchanged since late August. In five surveys conducted earlier in the year, Democrats led by one-to-four percentage points.

Six percent (6%) say they will vote for some other candidate while 14% are not sure.

Enthusiasm for voting increased across the board following the president’s speech.

Among those who are Very Motivated to vote, the Republicans lead by a 47% to 44% margin. That’s little changed from a month ago. The GOP advantage stems largely from the fact that voters who prefer policies of President Trump are more motivated to vote than others.

Among all Registered voters, Republicans have a modest 30% to 25% advantage.

Democrats have a huge lead among urban voters matched by a huge Republican lead among rural voters. Suburban voters are evenly divided.

Republicans lead among voters who are at least 55. Democrats lead among younger voters.

SIGN UP to receive Scott’s free email newsletter.

CHECK OUT Scott’s latest polls.

Note: Neither Scott Rasmussen, ScottRasmussen.com, nor RMG Research, Inc. have any affiliation with Rasmussen Reports. While Scott Rasmussen founded that firm, he left more than seven years ago and has had no involvement since that time.

Methodology

The survey of 1,200 Registered Voters was conducted by Scott Rasmussen using a mixed mode approach from September 10-11, 2021. Field work for the survey was conducted by RMG Research, Inc. Most respondents were contacted online or via text while 239 were contacted using automated phone polling techniques. Online respondents were selected from a list of Registered Voters and through a process of Random Digital Engagement. Certain quotas were applied, and the sample was lightly weighted by geography, gender, age, race, education, internet usage, and political party to reasonably reflect the nation’s population of Registered Voters. Other variables were reviewed to ensure that the final sample is representative of that population.

The margin of sampling error for the full sample is +/- 2.8 percentage points.

Posted in Uncategorized | Tagged ,

Scott's Newsletter
Sign up for Scott's newsletter and get his political insight delivered right to your inbox!

Following Biden Speech, Interest in Midterm Elections Up Across the Board

Following President Biden’s speech announcing new COVID mandates, 63% of Registered Voters feel Very Motivated to cast a ballot in next year’s midterm elections. That’s up five points from a Scott Rasmussen national survey conducted in late August.

The increased enthusiasm was found across the board.

  • Voters who prefer policies like those of former President Trump continue to have the highest level of motivation. Seventy percent (75%) of these populist voters are Very Motivated, up five points from the previous survey.
  • Among the smaller number who prefer traditional Republican policies, 56% are now Very Motivated, up six.
  • Sixty-seven percent (67%) of those who prefer policies like those of Senator Bernie Sanders, up seven.
  • Sixty-six percent (66%) of those who prefer traditional Democratic candidates are now Very Motivated, up five.

Overall, 72% of Republicans are Very Motivated along with 69% of Democrats.

However, among independent voters, 77% of those who lean Republican are Very Motivated to cast a ballot in the midterms. Just 57% of those who lean towards the Democrats are that enthusiastic.

The survey was conducted on the Friday and Saturday following the president’s speech. It will be interesting to see if the new level of interest is just a temporary blip or a lasting change.

SIGN UP to receive Scott’s free email newsletter.

CHECK OUT Scott’s latest polls.

Note: Neither Scott Rasmussen, ScottRasmussen.com, nor RMG Research, Inc. have any affiliation with Rasmussen Reports. While Scott Rasmussen founded that firm, he left more than seven years ago and has had no involvement since that time.

Methodology

The survey of 1,200 Registered Voters was conducted by Scott Rasmussen using a mixed mode approach from September 10-11, 2021. Field work for the survey was conducted by RMG Research, Inc. Most respondents were contacted online or via text while 239 were contacted using automated phone polling techniques. Online respondents were selected from a list of Registered Voters and through a process of Random Digital Engagement. Certain quotas were applied, and the sample was lightly weighted by geography, gender, age, race, education, internet usage, and political party to reasonably reflect the nation’s population of Registered Voters. Other variables were reviewed to ensure that the final sample is representative of that population.

The margin of sampling error for the full sample is +/- 2.8 percentage points.


Posted in Poll Results | Tagged , ,

Scott's Newsletter
Sign up for Scott's newsletter and get his political insight delivered right to your inbox!

46% of Dems Think Things Would Be Better If Sanders was President; 10% Think Things Would Be Worse

Forty-six percent (46%) of Democrats believe that things would be better today if Senator Bernie Sanders had become president instead of Joe Biden. A Scott Rasmussen national survey found that only 10% of Democrats disagree and believe things would be worse with a President Sanders. Thirty-seven percent (37%) believe things would be about the same.

Among all voters, 29% think things would be better, 24% say worse, and 37% about the same.

The survey also found that 41% of voters nationwide think it’s likely Sanders could have defeated President Donald Trump in the 2020 election. However, 46% consider it unlikely and 13% are not sure.

Those figures include 19% who think it’s Very Likely Sanders could have defeated Trump and 22% who say Not at All Likely.

SIGN UP to receive Scott’s free email newsletter.

CHECK OUT Scott’s latest polls.

Note: Neither Scott Rasmussen, ScottRasmussen.com, nor RMG Research, Inc. have any affiliation with Rasmussen Reports. While Scott Rasmussen founded that firm, he left more than seven years ago and has had no involvement since that time.

Methodology

The survey of 1,200 Registered Voters was conducted by Scott Rasmussen using a mixed mode approach from August 26-29, 2021. Field work for the survey was conducted by RMG Research, Inc. Most respondents were contacted online or via text while 236 were contacted using automated phone polling techniques. Online respondents were selected from a list of Registered Voters and through a process of Random Digital Engagement. Certain quotas were applied, and the sample was lightly weighted by geography, gender, age, race, education, internet usage, and political party to reasonably reflect the nation’s population of Registered Voters. Other variables were reviewed to ensure that the final sample is representative of that population.

The margin of sampling error for the full sample is +/- 2.8 percentage points.

Posted in Poll Results | Tagged , ,

Scott's Newsletter
Sign up for Scott's newsletter and get his political insight delivered right to your inbox!

DeSantis Leads Crist, Fried in Bid for Re-election

Florida Governor Ron DeSantis has a modest lead over a pair of potential Democratic rivals among Registered Voters. However, his lead is more substantial among those Very Motivated to take part in the 2022 midterm elections.

Among Registered Voters, DeSantis leads both Charlie Crist and Nikki Fried by a 41% to 38% margin.

However, among the most motivated voters, DeSantis leads Crist by a 49% to 42% margin and Fried by a 49% to 40% margin.

Sixty-two percent (62%) of Florida’s Registered Voters think it’s time to move forward by adapting to the ongoing nature of the pandemic. Just 25% believe it would be better to lockdown again until the pandemic is completely behind us.

Overall, 49% of Florida voters approve of the way that DeSantis has handled his job while 44% disapprove. Among the Very Motivated voters, 54% approve of DeSantis.

These overall dynamics are consistent with other survey research. Nationwide, on the generic ballot, Republicans and Democrats are tied among Registered Voters. However, the GOP has a 5-point advantage among the motivated voters.

Other data from the surveys will be released in the coming days.

SIGN UP to receive Scott’s free email newsletter.

CHECK OUT Scott’s latest polls.

Note: Neither Scott Rasmussen, ScottRasmussen.com, nor RMG Research, Inc. have any affiliation with Rasmussen Reports. While Scott Rasmussen founded that firm, he left more than seven years ago and has had no involvement since that time.

Methodology

The survey of 1,000 Registered Voters in Florida was conducted by Scott Rasmussen using a mixed mode approach from August 21-28, 2021. Field work for the survey was conducted by RMG Research, Inc. Most respondents were contacted online or via text while 149 were contacted using automated phone polling techniques. Online respondents were selected from a list of Registered Voters and through a process of Random Digital Engagement. Certain quotas were applied, and the sample was lightly weighted by geography, gender, age, race, education, internet usage, and political party to reasonably reflect the state’s population of Registered Voters. Other variables were reviewed to ensure that the final sample is representative of that population.

The margin of sampling error for the full sample is +/- 3.1 percentage points.

Posted in Poll Results | Tagged ,

Scott's Newsletter
Sign up for Scott's newsletter and get his political insight delivered right to your inbox!

Generic Congressional Ballot: Tied Among Registered Voters; However, Among Very Motivated Voters GOP Has 5-Point Lead

If the election were held today,  40% of Registered Voters would vote for the Democrat from their Congressional District while 40% would vote for the Republican. The latest Scott Rasmussen poll is the first time the parties have been even on this basic measure of the political environment. In five earlier surveys, Democrats led by one-to-four percentage points.

At the beginning of August, Democrats held a 42% to 40% advantage.


This month, for the first time, the survey asked about enthusiasm for voting in the midterm elections. Among those who are Very Motivated to vote, the Republicans lead by a 48% to 43% margin. This five-point edge stems largely from the fact that voters who prefer policies of President Trump are more motivated to vote than others.


Among voters who prefer Traditional Republican policies, just 55% are committed to voting for a GOP candidate. Sixteen percent (16%) say they would vote for a Democrat. However, those who want Traditional GOP policies are significantly less motivated than other voters.


The survey was conducted at a time when the Biden Administration is struggling on many fronts. As a result, it is impossible to know whether the shifts in the generic ballot reflect merely a temporary blip or are the beginning of a longer-term trend.

One major challenge for the president is that just 45% of voters have confidence in the ability of the Biden Administration to keep America safe. Following the chaotic withdrawal from Afghanistan, 49% of all voters believe that our enemies view us as weaker than before. Just 21% disagree.

The situation at the Southern border may also be a factor in the general lack of confidence. Just 28% of voters believe the federal government today is seriously trying to secure the border and reduce illegal immigration. There is a strong belief that many of those crossing the border illegally are drug dealers, human traffickers, and more.

Adding to the president’s burden, pessimism about the pandemic is growing again. Just 25% of voters believe the worst is behind us. That’s down 31 points over the past three months and the lowest level of optimism measured since the vaccines became available.

On top of all that, and perhaps because of the above issues, economic confidence has fallen.

SIGN UP to receive Scott’s free email newsletter.

CHECK OUT Scott’s latest polls.

Note: Neither Scott Rasmussen, ScottRasmussen.com, nor RMG Research, Inc. have any affiliation with Rasmussen Reports. While Scott Rasmussen founded that firm, he left more than seven years ago and has had no involvement since that time.

Methodology

The survey of 1,200 Registered Voters was conducted by Scott Rasmussen using a mixed mode approach from August 26-29, 2021. Field work for the survey was conducted by RMG Research, Inc. Most respondents were contacted online or via text while 236 were contacted using automated phone polling techniques. Online respondents were selected from a list of Registered Voters and through a process of Random Digital Engagement. Certain quotas were applied, and the sample was lightly weighted by geography, gender, age, race, education, internet usage, and political party to reasonably reflect the nation’s population of Registered Voters. Other variables were reviewed to ensure that the final sample is representative of that population.

The margin of sampling error for the full sample is +/- 2.8 percentage points.

Posted in Uncategorized | Tagged ,

Scott's Newsletter
Sign up for Scott's newsletter and get his political insight delivered right to your inbox!

Generic Ballot: Democrats 42% Republicans 40%

If the election were held today,  42% of Registered Voters would vote for the Democrat from their Congressional District while 40% would vote for the Republican. Those numbers are little changed since mid-July. In fact, the numbers have held steady for months.

Democrats enjoy a massive 62% to 24% advantage among urban voters. Republicans lead by 8 percentage points among suburban voters and by 13 among rural voters.

Not surprisingly, voters are also divided as to who they trust on election reform issues. Thirty-six percent (36%) trust the Democrats, 32% trust the GOP, and 22% don’t trust either party.

Other data highlights several challenges facing the Democrats as they look to the midterms.

Given a choice, 68% of voters prefer a Congressional candidate who believed that all voters should be required to show photo ID before casting a ballot. Just 19% would cast their ballot for a candidate who voted to ban the use of photo ID requirements. That ban is included in the “For the People Act,” legislation supported by virtually every Democrat in Congress.

That legislation also runs afoul of the strong public support for having all mail-in ballots received by Election Day.

On the economic front, the collapse in confidence concerning the pandemic has not dented public perceptions of their personal finances. However, despite assurances to the contrary, 61% of voters believe the Biden Administration will raise taxes on the middle class. Additionally, 59% believe an increase in government spending leads to inflation.


SIGN UP to receive Scott’s free email newsletter.

CHECK OUT Scott’s latest polls.

Note: Neither Scott Rasmussen, ScottRasmussen.com, nor RMG Research, Inc. have any affiliation with Rasmussen Reports. While Scott Rasmussen founded that firm, he left more than seven years ago and has had no involvement since that time.

Methodology

The survey of 1,200 Registered Voters was conducted by Scott Rasmussen using a mixed mode approach from August 5-7, 2021. Field work for the survey was conducted by RMG Research, Inc. Most respondents were contacted online or via text while 236 were contacted using automated phone polling techniques. Online respondents were selected from a list of Registered Voters and through a process of Random Digital Engagement. Certain quotas were applied, and the sample was lightly weighted by geography, gender, age, race, education, internet usage, and political party to reasonably reflect the nation’s population of Registered Voters. Other variables were reviewed to ensure that the final sample is representative of that population.

Posted in Poll Results | Tagged ,

Scott's Newsletter
Sign up for Scott's newsletter and get his political insight delivered right to your inbox!

68% Support Candidate Who Supports Photo ID Requirements; 19% Prefer Candidate Who Voted to Ban Use of Photo ID

Given a choice, 68% of voters prefer a Congressional candidate who believed that all voters should be required to show photo ID before casting a ballot. A Scott Rasmussen national survey found that just 19% would cast their ballot for a candidate who voted to ban the use of photo ID requirements.

The candidate supporting photo ID requirements is preferred by 70% of White voters, 68% of Hispanic voters, and 56% of Black voters.

Eighty-eight percent (88%) of Republicans prefer the candidate supporting photo IDs. Independents, by a 62% to 10% margin, agree. Among Democrats, 50% prefer the candidate supporting photo ID while 32% take the opposite view.

This could be a significant challenge for Democrats in the 2022 midterm elections. The “For the People Act” effectively banned the use of photo ID requirements for elections. Virtually all Democrats in Congress have voted for that legislation.

Advocates of the  “For the People Act,” argue that the bill would not technically ban photo ID requirements. In their view, the legislation simply provides a workaround for people who don’t have photo IDs. Anybody would be allowed to vote by providing a sworn, written statement to an election official stating that they are eligible to vote. However, only 19% of voters consider that an acceptable substitute. Seventy-three percent (73%) are opposed.

SIGN UP to receive Scott’s free email newsletter.

CHECK OUT Scott’s latest polls.

Note: Neither Scott Rasmussen, ScottRasmussen.com, nor RMG Research, Inc. have any affiliation with Rasmussen Reports. While Scott Rasmussen founded that firm, he left more than seven years ago and has had no involvement since that time.

Methodology

The survey of 1,200 Registered Voters was conducted by Scott Rasmussen using a mixed mode approach from August 5-7, 2021. Field work for the survey was conducted by RMG Research, Inc. Most respondents were contacted online or via text while 236 were contacted using automated phone polling techniques. Online respondents were selected from a list of Registered Voters and through a process of Random Digital Engagement. Certain quotas were applied, and the sample was lightly weighted by geography, gender, age, race, education, internet usage, and political party to reasonably reflect the nation’s population of Registered Voters. Other variables were reviewed to ensure that the final sample is representative of that population.

Posted in Poll Results | Tagged , ,

Scott's Newsletter
Sign up for Scott's newsletter and get his political insight delivered right to your inbox!

36% Trust Dems on Election Reform, 32% Trust GOP, 22% Neither

When it comes to reforming election practices, a Scott Rasmussen national survey found that 36% of voters trust Democrats, 32% trust Republicans and 22% don’t trust either party.

Among Independent voters, 62% don’t trust either of the major political parties.

Most voters with a postgraduate degree strongly trust Democrats more than Republicans. However, a modest plurality of all other voters places more trust in the GOP.

The survey also found that 59% believe the states should return to the regular voting laws that existed before the pandemic. Just 26% disagree. The Department of Justice recently issued guidance suggesting that a return to the pre-pandemic rules would not always be seen as legal.

Eighty-three percent (83%) of Republicans favor a return to pre-pandemic rules. Democrats are evenly divided: 40% favor that approach and 43% do not.

Among Independent voters, 46% favor a return to pre-pandemic rules while 25% are opposed.

SIGN UP to receive Scott’s free email newsletter.

CHECK OUT Scott’s latest polls.

Note: Neither Scott Rasmussen, ScottRasmussen.com, nor RMG Research, Inc. have any affiliation with Rasmussen Reports. While Scott Rasmussen founded that firm, he left more than seven years ago and has had no involvement since that time.

Methodology

The survey of 1,200 Registered Voters was conducted by Scott Rasmussen using a mixed mode approach from August 5-7, 2021. Field work for the survey was conducted by RMG Research, Inc. Most respondents were contacted online or via text while 236 were contacted using automated phone polling techniques. Online respondents were selected from a list of Registered Voters and through a process of Random Digital Engagement. Certain quotas were applied, and the sample was lightly weighted by geography, gender, age, race, education, internet usage, and political party to reasonably reflect the nation’s population of Registered Voters. Other variables were reviewed to ensure that the final sample is representative of that population.

Posted in Poll Results | Tagged ,

Scott's Newsletter
Sign up for Scott's newsletter and get his political insight delivered right to your inbox!

52% Want No Restrictions On Voting; 73% Favor Photo ID Requirements

Fifty-two percent (52%) of voters believe “voting is a fundamental right for every adult U.S. citizen and should not be restricted in any way.” A Scott Rasmussen survey found that 39% believe instead that “voting is a privilege that comes with responsibilities and can be limited if adult U.S. citizens don’t meet some requirements.”

The survey also found that 73% of voters believe all voters who cast their ballot in-person should be required to show a photo ID before voting. Just 17% disagree.

Additionally, 74% favor a proposal that would require all mail-in ballots to be received by Election Day. Seventeen percent (17%) are opposed.

These results suggest that voters do not see common sense voting rules as a restriction on voting.

In fact, among those who say there should be no restrictions on voting, 69% favor photo ID requirements and 70% believe all ballots should be received by Election Day.

The question about whether voting is a right or a privilege was modeled after a similar question asked by the Pew Research Center. The only difference is that the Scott Rasmussen question included a not sure option. However, the results from both surveys were very similar.

The Pew Center study found that 56% of voters are confident that those not legally qualified to vote are prevented from casting a ballot. Forty-two percent (42%) lack such confidence.

There is far more confidence in another aspect of the voting process. Seventy-seven percent (77%) of voters believe that everyone who is eligible and wants to vote is able to cast a ballot. Just 23% disagree.

SIGN UP to receive Scott’s free email newsletter.

CHECK OUT Scott’s latest polls.

Note: Neither Scott Rasmussen, ScottRasmussen.com, nor RMG Research, Inc. have any affiliation with Rasmussen Reports. While Scott Rasmussen founded that firm, he left more than seven years ago and has had no involvement since that time.

Methodology

The survey of 1,000 Registered Voters was conducted by Scott Rasmussen using a mixed mode approach from July 27-28, 2021. Field work for the survey was conducted by RMG Research, Inc. Most respondents were contacted online or via text while 232 were contacted using automated phone polling techniques. Online respondents were selected from a list of Registered Voters and through a process of Random Digital Engagement. Certain quotas were applied, and the sample was lightly weighted by geography, gender, age, race, education, internet usage, and political party to reasonably reflect the nation’s population of Registered Voters. Other variables were reviewed to ensure that the final sample is representative of that population.

Posted in Poll Results | Tagged ,

Scott's Newsletter
Sign up for Scott's newsletter and get his political insight delivered right to your inbox!

Generic Ballot: Democrats 41% Republicans 38%

If the election were held today,  41% of Registered Voters would vote for the Democrat from their Congressional District while 38% would vote for the Republican. Those numbers are unchanged from a month ago. A Scott Rasmussen national survey found that 7% would vote for some other candidate while 14% are not sure.

In early May, the Democrats were up by just a single point (41% to 40%).  The month before, President Biden’s party enjoyed a four-point advantage, 43% to 39%.

Democrats lead by a wide 60% to 29% margin among voters with a postgraduate degree. Among all other voters, the numbers are evenly divided: 40% favor the GOP and 38% favor the Democrats.

Democrats have a 57% to 25% advantage among Urban voters. Republicans lead among Suburban and Rural voters.

The Democratic advantage has held steady despite a collapse in confidence about the pandemic. In late May, 56% believed the worst of the pandemic was behind us. That optimism has now fallen to 34%. That’s a 22 point decline over the past two months. Confidence is now at the lowest level since the vaccines became available. In fact, for the first time since January, a plurality (38%) believes the worst is yet to come.

Looking back over the past year or so, 55% of voters agree that “Despite good intentions, shutting down businesses and locking down society did more harm than good.” Just  38% disagree and 7% are not sure.

On this topic, there is a racial divide within the Democratic Party. White Democrats, by a 65% to 32% margin, reject the idea that lockdowns did more harm than good. Black Democrats and Other Democrats are evenly divided.

During the pandemic, government officials exercised extraordinary power over the lives of individual Americans. The survey also found that 62% are worried that many government officials will try to continue exercising such power over individual Americans.

On this topic, there is also a divide within the Democratic Party. White Democrats, by a 57% to 39% margin, are not worried about government officials keeping too much power. Black Democrats, by a 64% to 27% margin, are worried.

Other recent surveys found that 84% of voters are confident they have access to Medical Care for serious health issues. Additionally,81% are at least somewhat satisfied with their choice of doctors.

SIGN UP to receive Scott’s free email newsletter.

CHECK OUT Scott’s latest polls.

Note: Neither Scott Rasmussen, ScottRasmussen.com, nor RMG Research, Inc. have any affiliation with Rasmussen Reports. While Scott Rasmussen founded that firm, he left more than seven years ago and has had no involvement since that time.

Methodology

The survey of 1,200 Registered Voters was conducted by Scott Rasmussen using a mixed mode approach from July 22-24, 2021. Field work for the survey was conducted by RMG Research, Inc. Most respondents were contacted online or via text while 271were contacted using automated phone polling techniques. Online respondents were selected from a list of Registered Voters and through a process of Random Digital Engagement. Certain quotas were applied, and the sample was lightly weighted by geography, gender, age, race, education, internet usage, and political party to reasonably reflect the nation’s population of Registered Voters. Other variables were reviewed to ensure that the final sample is representative of that population.

Posted in Uncategorized | Tagged ,

Scott's Newsletter
Sign up for Scott's newsletter and get his political insight delivered right to your inbox!

56% Prefer Candidate Who Supports Abortion During First Trimester Only

Given a choice, 56% of voters would support a candidate who said abortion should be allowed only during the first three months of a pregnancy rather than at any point during the pregnancy. A Scott Rasmussen national survey found that 23% hold the opposite view and 21% are not sure.

Republicans prefer the candidate supporting abortion rights during the first trimester only by a 69% to 13% margin. Independent voters hold the same view by a 50% to 16% margin.

Democrats are more evenly divided: 46% prefer the candidate who supports allowing an abortion only during the first three months while 35% would vote for the candidate allowing an abortion at any time during the pregnancy.

Data released earlier showed that 36% of voters believe it is too easy to get an abortion in America today. Twenty-six percent (26%) believe it is too hard.

SIGN UP to receive Scott’s free email newsletter.

CHECK OUT Scott’s latest polls.

Note: Neither Scott Rasmussen, ScottRasmussen.com, nor RMG Research, Inc. have any affiliation with Rasmussen Reports. While Scott Rasmussen founded that firm, he left more than seven years ago and has had no involvement since that time.

Methodology

The online survey of 1,000 Registered Voters was conducted by Scott Rasmussen July 12-13, 2021. Field work for the survey was conducted by RMG Research, Inc. Respondents were selected from a list of Registered Voters and through a process of Random Digital Engagement. Certain quotas were applied, and the sample was lightly weighted by geography, gender, age, race, education, internet usage, and political party to reasonably reflect the nation’s population of Registered Voters. Other variables were reviewed to ensure that the final sample is representative of that population.


Posted in Poll Results | Tagged , ,

Scott's Newsletter
Sign up for Scott's newsletter and get his political insight delivered right to your inbox!

Plurality of Voters Prefer Trump-like Policies

Given a choice between four presidential candidates with equal skills and temperament, 32% would prefer a candidate who supported policies like those of former President Trump. A Scott Rasmussen national survey found that 21% would like a candidate who supported policies like those of Senator Bernie Sanders; 21% favor a traditional Democrat; and, 15% favor a traditional Republican.

Voters under 45 are more likely to support Sanders-like policies. Older voters are more likely to support Trump-like policies.

Among urban voters, a plurality prefer Sanders-like policies. In the suburbs and rural areas, Trump-like policies are the most popular.

Among those with a college degree, a narrow plurality prefers policies like those of Senator Sanders. A solid plurality of those without a college degree prefer policies like those of President Trump.

It’s important to remember that the question focused on the policy preference assuming that the candidates had equal skills and temperament. As a result, it cannot be assumed that someone who supports policies like those of Trump or Sanders would automatically support Trump or Sanders as a candidate.

We have been asking this question regularly since last October. Despite the election results and everything that has happened since, these attitudes have remained remarkably stable. The current results are similar to those found in April.

  • These numbers show 47% favoring one of the Republican leaning options while 42% prefer a Democratic leaning set of policies. In every update of the survey, the partisan split has remained essentially even. That’s not surprising given that we have had nine consecutive presidential elections where neither candidate has received more than 53% of the vote. It’s the longest such stretch in American history.
  • On the Republican side, the number preferring Trump-like policies is consistently two to three times as large as the number favoring traditional GOP policies. However, younger GOP-leaning voters are more evenly divided.
  • On the other hand, the two wings of the Democratic party are always just about evenly divided.

SIGN UP to receive Scott’s free email newsletter.

CHECK OUT Scott’s latest polls.

Note: Neither Scott Rasmussen, ScottRasmussen.com, nor RMG Research, Inc. have any affiliation with Rasmussen Reports. While Scott Rasmussen founded that firm, he left more than seven years ago and has had no involvement since that time.

Methodology

The survey of 1,200 Registered Voters was conducted by Scott Rasmussen using a mixed mode approach from July 8-10, 2021. Field work for the survey was conducted by RMG Research, Inc. Most respondents were contacted online or via text while 231 were contacted using automated phone polling techniques. Online respondents were selected from a list of Registered Voters and through a process of Random Digital Engagement. Certain quotas were applied, and the sample was lightly weighted by geography, gender, age, race, education, internet usage, and political party to reasonably reflect the nation’s population of Registered Voters. Other variables were reviewed to ensure that the final sample is representative of that population.

Posted in Uncategorized | Tagged , , ,

Scott's Newsletter
Sign up for Scott's newsletter and get his political insight delivered right to your inbox!

59% of Voters Have Confidence in U.S. Election Results

Thinking in general about U.S. elections, 59% of voters are at least somewhat confident the votes are accurately counted and the proper person is declared the winner. A Scott Rasmussen national survey found that 36% lack such confidence and 5% are not sure.

Those totals include 38% who are Very Confident in the election process and 19% who are Not at All Confident.

Not surprisingly, there is a vast partisan divide on this issue. Eighty-seven percent (87%) of Democrats express confidence in the system while 63% or Republicans do not. Independent voters are evenly divided: 46% have some level of confidence while 41% do not.

This partisan divide is fairly typical– the party which controls the White House expresses is more likely to consider the process fair. For example, most Democrats still believe that Hillary Clinton was the legitimate winner of the 2016 election and most Republicans believe Donald Trump was the legitimate winner in 2020. Overall, just 26% of voters believe that the right person was declared the winner in both the 2016 and 2020 presidential elections.

The partisan divide helps explain the wildly different perceptions of voting rights’ legislation. Since 9-out-of-10 Democrats have confidence in the system, they see any move to change voting rules as negative. Since Republicans lack confidence in the system, they see a need for improvement. It is likely these positions will be reversed the next time a Republican wins the White House.

Despite the intense partisan polarization, several election reforms are very popular among voters from all partisan and demographic groups:

SIGN UP to receive Scott’s free email newsletter.

CHECK OUT Scott’s latest polls.

Note: Neither Scott Rasmussen, ScottRasmussen.com, nor RMG Research, Inc. have any affiliation with Rasmussen Reports. While Scott Rasmussen founded that firm, he left more than seven years ago and has had no involvement since that time.

Methodology

The survey of 1,200 Registered Voters was conducted by Scott Rasmussen using a mixed mode approach from July 8-10, 2021. Field work for the survey was conducted by RMG Research, Inc. Most respondents were contacted online or via text while 231 were contacted using automated phone polling techniques. Online respondents were selected from a list of Registered Voters and through a process of Random Digital Engagement. Certain quotas were applied, and the sample was lightly weighted by geography, gender, age, race, education, internet usage, and political party to reasonably reflect the nation’s population of Registered Voters. Other variables were reviewed to ensure that the final sample is representative of that population.


Posted in Poll Results | Tagged ,

Scott's Newsletter
Sign up for Scott's newsletter and get his political insight delivered right to your inbox!

57% Want Ballot Harvesting Banned; 20% Disagree

Fifty-seven percent (57%) of voters believe “ballot harvesting” should be outlawed. A Scott Rasmussen national survey found that 20% disagree and 23% are not sure.

The United States Supreme Court recently upheld an Arizona law banning ballot harvesting.

Another provision of the Arizona law declared that votes cast by an individual in the wrong precinct would not be allowed. That provision was also upheld.

However, while there is strong support for ending ballot harvesting, voters have mixed views about ballots cast in the wrong precinct. Forty percent (40%) believe such votes should be counted while 45% say they should not.

Sixty-five percent (65%) of Republicans believe ballots cast in the wrong precinct should not be counted. Fifty-seven percent (57%) of Democrats believe those votes should count. Independent voters are evenly divided.

Data released earlier showed that 70% of voters want all mail-in ballots to be received by Election Day. Sixty-five percent (65%) believe government agencies should be required to report the vote totals from all ballots either on Election Night or the next day.

Concerns about the election process are highlighted by the fact that just 26% of voters believe that the right person was declared the winner in both the 2016 and 2020 presidential elections.

Most voters (56%) believe at least one of the last two presidents was illegitimately put into office. That includes 26% who believe Hillary Clinton was the legitimate winner in 2016 and 31% who believe Donald Trump was the legitimate winner in 2020.

Seventy-six percent (76%) believe voters should be required to show photo ID before casting a ballot. The ban on photo ID requirements has been one of the most unpopular aspects of the “For The People Act.” That law would also prohibit states from requiring all ballots to be received by Election Day.

Seventy-eight percent (78%) of voters are concerned that giant tech companies can swing an election in favor of their preferred candidate. Fifty-five percent (55%) of voters believe letting government bureaucrats set rules without approval of Congress or voters is a major threat to democracy.

SIGN UP to receive Scott’s free email newsletter.

CHECK OUT Scott’s latest polls.

Note: Neither Scott Rasmussen, ScottRasmussen.com, nor RMG Research, Inc. have any affiliation with Rasmussen Reports. While Scott Rasmussen founded that firm, he left more than seven years ago and has had no involvement since that time.

Methodology

The survey of 1,200 Registered Voters was conducted by Scott Rasmussen using a mixed mode approach from July 8-10, 2021. Field work for the survey was conducted by RMG Research, Inc. Most respondents were contacted online or via text while 231 were contacted using automated phone polling techniques. Online respondents were selected from a list of Registered Voters and through a process of Random Digital Engagement. Certain quotas were applied, and the sample was lightly weighted by geography, gender, age, race, education, internet usage, and political party to reasonably reflect the nation’s population of Registered Voters. Other variables were reviewed to ensure that the final sample is representative of that population.

Posted in Poll Results | Tagged ,

Scott's Newsletter
Sign up for Scott's newsletter and get his political insight delivered right to your inbox!

70% Want All Mail-In Ballots Received By Election Day

Seventy percent (70%) of voters want all mail-in ballots to be received by Election Day. A Scott Rasmussen national survey found that 21% are opposed to that requirement and 9% are not sure.

Those totals include 47% who Strongly Favor the Election Day deadline and 11% who are Strongly Opposed.

Requiring mail-in ballots to be received by Election Day is favored by 83% of Republicans, 63% of Democrats, and 55% of Independent voters. In fact, that requirement is favored by a majority of every measured demographic group.

The survey also found that 65% believe government agencies should be required to report the vote totals from all ballots either on Election Night or the next day. Eighteen percent (18%) are opposed to such a requirement and 16% are not sure.

SIGN UP to receive Scott’s free email newsletter.

CHECK OUT Scott’s latest polls.

Note: Neither Scott Rasmussen, ScottRasmussen.com, nor RMG Research, Inc. have any affiliation with Rasmussen Reports. While Scott Rasmussen founded that firm, he left more than seven years ago and has had no involvement since that time.

Methodology

The survey of 1,200 Registered Voters was conducted by Scott Rasmussen using a mixed mode approach from July 8-10, 2021. Field work for the survey was conducted by RMG Research, Inc. Most respondents were contacted online or via text while 231 were contacted using automated phone polling techniques. Online respondents were selected from a list of Registered Voters and through a process of Random Digital Engagement. Certain quotas were applied, and the sample was lightly weighted by geography, gender, age, race, education, internet usage, and political party to reasonably reflect the nation’s population of Registered Voters. Other variables were reviewed to ensure that the final sample is representative of that population.

Posted in Poll Results | Tagged ,

Scott's Newsletter
Sign up for Scott's newsletter and get his political insight delivered right to your inbox!

78% Believe Tech Companies Could Swing Election to Candidate They Like

Seventy-eight percent (78%) of voters believe tech companies like Twitter, Facebook, and Google  could swing the results of the election to benefit their preferred candidate. A Scott Rasmussen national survey found that just 10% found that prospect unlikely.

The totals include 47% who say it’s Very Likely they could swing an election and just 3% who say it’s Not at All Likely.

Eighty-two percent (82%) of Republicans believe the tech companies could swing an election. So do 82% of Democrats.

The survey also found that 62% believe technology companies have too much influence on our politics and political campaigns. Just 6% say they have too little influence. Nineteen percent (19%) believe the level of influence is about right.

SIGN UP to receive Scott’s free email newsletter.

CHECK OUT Scott’s latest polls.

Note: Neither Scott Rasmussen, ScottRasmussen.com, nor RMG Research, Inc. have any affiliation with Rasmussen Reports. While Scott Rasmussen founded that firm, he left more than seven years ago and has had no involvement since that time.

Methodology

The online survey of 1,000 Registered Voters was conducted by Scott Rasmussen on June 24-27, 2021. Field work for the survey was conducted by RMG Research, Inc.   Certain quotas were applied, and the sample was lightly weighted by geography, gender, age, race, education, internet usage, and political party to reasonably reflect the nation’s population of Registered Voters. Other variables were reviewed to ensure that the final sample is representative of that population.

Posted in Poll Results | Tagged , ,

Scott's Newsletter
Sign up for Scott's newsletter and get his political insight delivered right to your inbox!

54% Favor Freedom & Equality Candidate; 29% Prefer Social Justice & Equity Candidate

Given a choice two candidates for Congress, 54% would choose the candidate who campaigned on the need for “freedom and equality” over a candidate who campaigned on the need for “social justice and equity.” A Scott Rasmussen national survey found that 29% would prefer the candidate who promoted “social justice and equity.” Seventeen percent are not sure.

As a national objective, 52% prefer “equality” while just 16% favor “equity.” Twenty percent (20%) do not understand the difference and 12% are not sure.

Republicans prefer the “freedom and equality” candidate by a 3-to-1 margin. Independents favor that candidate by a 2-to-1 margin. Democrats also prefer that candidate, but by a narrower 49% to 38% margin.

On this question, there is a significant divide within the Democratic coalition. Those who prefer traditional democratic policies prefer the “freedom and equality” candidate by a 57% to 31% margin. That’s very close to the overall numbers for all voters.

However, those who prefer Sanders-like policies prefer the “social justice and equity” candidate by a 46% to 41% margin.

No other measured demographic group prefers the “social justice and equity” candidate. However, voters who prefer an open-borders immigration policy are pretty evenly divided. Forty-four percent (44%) prefer the “freedom and equality” candidate while 40% go for the “social justice and equity ” candidate.

Those with a mainstream view of immigration policy favor the “freedom and equality” candidate by a 60% to 26% margin.

The mainstream view on immigration policy is defined as those who believe legal immigration is good for the United States but illegal immigration is bad. Over a period of many years, a solid majority of voters have held that view.


SIGN UP to receive Scott’s free email newsletter.

CHECK OUT Scott’s latest polls.

Note: Neither Scott Rasmussen, ScottRasmussen.com, nor RMG Research, Inc. have any affiliation with Rasmussen Reports. While Scott Rasmussen founded that firm, he left more than seven years ago and has had no involvement since that time.

Methodology

The survey of 1,200 Registered Voters was conducted by Scott Rasmussen using a mixed mode approach from June 22-24, 2021. Field work for the survey was conducted by RMG Research, Inc. Most respondents were contacted online or via text while 205 were contacted using automated phone polling techniques. Online respondents were selected from a list of Registered Voters and through a process of Random Digital Engagement. Certain quotas were applied, and the sample was lightly weighted by geography, gender, age, race, education, internet usage, and political party to reasonably reflect the nation’s population of Registered Voters. Other variables were reviewed to ensure that the final sample is representative of that population.


Posted in Poll Results | Tagged ,

Scott's Newsletter
Sign up for Scott's newsletter and get his political insight delivered right to your inbox!

Generic Ballot: Democrats 41% Republicans 38%

If the election were held today,  41% of Registered Voters would vote for the Democrat from their Congressional District while 38% would vote for the Republican. A Scott Rasmussen national survey found that 6% would vote for some other candidate while 14% are not sure.

In early May, the Democrats were up by just a single point (41% to 40%).  The month before, President Biden’s party enjoyed a four-point advantage, 43% to 39%.

A big wild card in the midterm elections will be independent voters. Currently, 19% of them favor the GOP and 11% would vote for a Democrat. However, 70% would either vote for some other candidate (23%) or are undecided (47%). As always, undecided voters have two decisions to make. The first is whether or not to vote, the second is for whom.

Scott Rasmussen’s most recent column looks at why voters distrust government experts. One stunning figure in the column is that 55% of voters believe that letting government bureaucrats set rules without approval of Congress or voters is a major threat to democracy.

One major example of the underlying distrust can be found in reaction the pandemic lab-leak theory. Fifty-seven percent (57%) of voters think it is at least somewhat likely that US Government Officials actively tried to cover-up that theory.

Other recent polls show that 32% say their Personal Finances are getting better while 28% have the opposite view. Thirty-three percent (33%) of voters believe most executives of giant corporations favor Democrats. Twenty-nine percent (29%) think they prefer the GOP.

Methodology

The survey of 1,200 Registered Voters was conducted by Scott Rasmussen using a mixed mode approach from June 22-24, 2021. Field work for the survey was conducted by RMG Research, Inc. Most respondents were contacted online or via text while 205 were contacted using automated phone polling techniques. Online respondents were selected from a list of Registered Voters and through a process of Random Digital Engagement. Certain quotas were applied, and the sample was lightly weighted by geography, gender, age, race, education, internet usage, and political party to reasonably reflect the nation’s population of Registered Voters. Other variables were reviewed to ensure that the final sample is representative of that population.

Posted in Uncategorized | Tagged , ,

Scott's Newsletter
Sign up for Scott's newsletter and get his political insight delivered right to your inbox!

Generic Congressional Ballot: Democrats 41% Republican 40%

If the election were held today,  41% of Registered Voters would vote for the Democrat from their Congressional District while 40% would vote for the Republican. A Scott Rasmussen national survey found that 6% would vote for some other candidate while 14% are not sure.

That’s a bit closer than last month when Democrats enjoyed a four-point advantage, 43% to 39%.

The tightening results from growing loyalty among GOP voters. Last month, just 85% of GOP voters said they would vote for the Republican from their district. That’s up to 91% now, a figure that matches Democratic support for their party’s candidate.

Just 3% of GOP voters now say they’d vote for the Democrat from their district. That’s down from 6% a month ago.

Independent voters remain evenly divided in both surveys.

As with last month, Democrats lead by a wide margin, 51% to 32%, among voters who are online “almost constantly.” Republicans lead among the rest of the nation’s voters by a 43% to 36% margin. That’s consistent with the fact that 42% of those online constantly are Democrats. Just 27% align with the GOP.

It is impossible to know at this point whether these new numbers reflect a real tightening of the race or are merely statistical noise.

Other recent survey results show that 70% of voters view immigration and border control as a national security issue. Overall, 63% of voters believe that legal immigration is good for the United States while illegal immigration is bad.  Just 14% believe both legal and illegal immigration are bad for the nation while 11% believe both are good.

Additionally, 58% of voters believe that drug cartels have more control of the Southern border than the U.S. government. On top of that, 52% believe the Biden Administration is making it too easy for illegal immigrants to enter the nation. Just 28% disagree.

On a different topic, 46% of voters nationwide believe that America is a racist nation. A Scott Rasmussen national survey found that 40% disagree and 14% are not sure.

Finally, by a 49% to 29% margin, voters prefer a more focused $600 Billion infrastructure plan rather than the president’s $1.9 trillion approach.

SIGN UP to receive Scott’s free email newsletter.

CHECK OUT Scott’s latest polls.

Note: Neither Scott Rasmussen, ScottRasmussen.com, nor RMG Research, Inc. have any affiliation with Rasmussen Reports. While Scott Rasmussen founded that firm, he left more than seven years ago and has had no involvement since that time.

Methodology

The online survey of 1,000 Registered Voters was conducted by Scott Rasmussen from May 6-8, 2021. Field work for the survey was conducted by RMG Research, Inc. Respondents were selected from a list of Registered Voters and through a process of Random Digital Engagement. Certain quotas were applied, and the sample was lightly weighted by geography, gender, age, race, education, internet usage, and political party to reasonably reflect the nation’s population of Registered Voters. Other variables were reviewed to ensure that the final sample is representative of that population.

Posted in Uncategorized | Tagged ,

Scott's Newsletter
Sign up for Scott's newsletter and get his political insight delivered right to your inbox!

31% Prefer a Candidate Pursuing Trump-like Policies

Given a choice between four presidential candidates with equal skills and temperament, 31% would prefer a candidate who supported policies like those of President Trump. A Scott Rasmussen national survey found that 24% would like a candidate who supported policies like those of Senator Bernie Sanders; 20% favor a traditional Democrat; and, 15% favor a traditional Republican.

We have been asking this question regularly since last October. Despite the election results and everything that has happened since, these attitudes have remained remarkably stable.

  • These numbers show 46% favoring one of the Republican leaning options while 44% prefer a Democratic leaning set of policies. In every update of the survey, the partisan split has remained essentially even. That’s not surprising given that we have had nine consecutive presidential elections where neither candidate has received more than 53% of the vote. It’s the longest such stretch in American history.
  • On the Republican side, the number preferring Trump-like policies is consistently two to three times as large as the number favoring traditional GOP policies. However, younger GOP-leaning voters are more evenly divided.
  • On the other hand, the two wings of the Democratic party are always just about evenly divided.
  • Urban voters strongly support one of the Democratic options. Those in the suburbs lean towards one of the GOP options while rural voters prefer the GOP.
  • Those favoring populist policies (Trump or Sanders) consistently outnumber those favoring more traditional policies. This week, the numbers show 55% favoring populist policies while 35% prefer a more traditional approach.

SIGN UP to receive Scott’s free email newsletter.

CHECK OUT Scott’s latest polls.

Note: Neither Scott Rasmussen, ScottRasmussen.com, nor RMG Research, Inc. have any affiliation with Rasmussen Reports. While Scott Rasmussen founded that firm, he left more than seven years ago and has had no involvement since that time.

Methodology

The survey of 1,200 Registered Voters was conducted by Scott Rasmussen using a mixed mode approach from April 15-17, 2021. Field work for the survey was conducted by RMG Research, Inc. Most respondents were contacted online or via text while 261 were contacted using automated phone polling techniques. Online respondents were selected from a list of Registered Voters and through a process of Random Digital Engagement. Certain quotas were applied, and the sample was lightly weighted by geography, gender, age, race, education, internet usage, and political party to reasonably reflect the nation’s population of Registered Voters. Other variables were reviewed to ensure that the final sample is representative of that population.

Posted in Uncategorized | Tagged , , ,

Scott's Newsletter
Sign up for Scott's newsletter and get his political insight delivered right to your inbox!

Generic Congressional Ballot: Democrats 43% Republicans 39%

If the election were held today,  43% of Registered Voters would vote for the Democrat from their Congressional District while 39% would vote for the Republican. A Scott Rasmussen national survey found that 5% would vote for some other candidate while 14% are not sure.

Democrats lead by a wide margin, 50% to 33%, among voters who are online “almost constantly.” Republicans have a narrow edge, 42% to 39% among the rest of the nation’s voters. That’s consistent with the fact that 42% of those online constantly are Democrats. Just 27% align with the GOP.

Among all Democrats, 91% say they would vote for their party’s candidate. Just 85% of Republicans say the same. Independent voters are evenly divided, with 35% undecided. Twelve percent (12%) of Independent voters say they would prefer a third candidate option.

The relative weakness in Republican partisan loyalty can be traced to the small wing of the party that prefers Traditional Republican policy positions. Among these old-school Republicans, just 55% plan to vote for the GOP candidate. Seventeen percent (17%) of these voters say they’ll vote for the Democratic candidate, 9% are not sure, and 19% are undecided.

Among those who prefer a candidate promoting Trump like policies, 90% plan to vote for the Republican candidate. They remain the dominant wing of the party.

This reflects a long-running divide in the GOP.  In the 2012 Republican presidential primaries, Tea Party Republicans were committed to voting for whoever won the party’s nomination. Traditional Republicans at that time were far more likely to abandon the party if their preferred candidate didn’t win the nomination.

Looking ahead to 2022, this dynamic can play out in many ways. If the traditional Republicans fail to support their party’s Congressional candidates, this divide could significantly limit Republican midterm gains. On the other hand, it is quite possible that the policies of the Biden Administration will push many of these traditional Republicans to support GOP candidates. Following President Biden’s first month in office, there was a significant increase in the number of people believing the country will become even more polarized.

Other recent polling shows that 41% Believe the worst of the pandemic is behind us while 32% believe the worst is yet to come. That’s unchanged over the past six weeks. Prior to that, the arrival of COVID vaccines spurred a significant growth in confidence. However, that growth has stalled.

Additionally, 28% say their finances are getting better while 21% Say Worse. That, too, is little changed. Economic confidence at this time is closely tied to confidence that we are moving beyond the pandemic.

On another topic, 25% say requiring Photo ID’s is a form of voter suppression. Sixty-six percent (66% Disagree).

Support for policies of a certain candidate were determined by the following question: Suppose you had a choice between four presidential candidates. All four had equal skills and temperament. Would you prefer a Republican who supported policies like President Trump, a more traditional Republican, a Democrat who supported policies similar to Senator Bernie Sanders, or a more traditional Democrat?

Over the past six months, responses to this question show that, on the GOP side of the aisle, Trump policies are strongly preferred over a traditional Republican. Democrats, on the other hand, are even divided between those who favor traditional Democrats or candidates pursuing Sanders’ policies.

SIGN UP to receive Scott’s free email newsletter.

CHECK OUT Scott’s latest polls.

Note: Neither Scott Rasmussen, ScottRasmussen.com, nor RMG Research, Inc. have any affiliation with Rasmussen Reports. While Scott Rasmussen founded that firm, he left more than seven years ago and has had no involvement since that time.

Methodology

The survey of 1,200 Registered Voters was conducted by Scott Rasmussen using a mixed mode approach from April 15-17, 2021. Field work for the survey was conducted by RMG Research, Inc. Most respondents were contacted online or via text while 261 were contacted using automated phone polling techniques. Online respondents were selected from a list of Registered Voters and through a process of Random Digital Engagement. Certain quotas were applied, and the sample was lightly weighted by geography, gender, age, race, education, internet usage, and political party to reasonably reflect the nation’s population of Registered Voters. Other variables were reviewed to ensure that the final sample is representative of that population.


Posted in Uncategorized | Tagged ,

Scott's Newsletter
Sign up for Scott's newsletter and get his political insight delivered right to your inbox!

52% Favor Populist Policies, 37% Prefer Traditional Politics

Given a choice between four presidential candidates with equal skills and temperament, 52% of voters would favor a candidate promoting populist policies such as those advocated by Donald Trump or Bernie Sanders. A Scott Rasmussen national survey found that 37% would prefer more traditional establishment policies.

On a partisan basis, the results are nearly even: 45% want either Trump-like or traditional Republican policies while 44% prefer either Sanders-like or traditional Democratic policies. Overall, the results are very similar to the numbers found last October.

The totals include 30% who prefer policies like those of Trump and 15% who would rather see traditional Republican policies. On the other side of the aisle, 22% prefer policies like those offered by Sanders and 22% favor traditional Democratic policies.

Scott Rasmussen has been asking this question on a weekly basis. While the numbers periodically fluctuate, the dynamics are always the same. The partisan preference is split down the middle.

Within the parties, though, things appear to be much different. On the Republican side, the Trump like policies dominate. Typically, those supporting such policies outnumber those who would like more traditional policies by a 2 or 3 to 1 margin. On the Democratic side, the establishment and populist forces are virtually equal in number.

These results suggest potential for a significant shift in the partisan alignment over the coming years. What that alignment might be is unclear. For example, it’s easy to envision those who favor traditional Republican or traditional Democratic policies finding common ground. However, such an alliance in one party might push populists into the other party.

For now, these results provide a useful way to analyze the electorate.

SIGN UP to receive Scott’s free email newsletter.

CHECK OUT Scott’s latest polls.

Note: Neither Scott Rasmussen, ScottRasmussen.com, nor RMG Research, Inc. have any affiliation with Rasmussen Reports. While Scott Rasmussen founded that firm, he left more than seven years ago and has had no involvement since that time.

Methodology

The survey of 1,200 Registered Voters was conducted by Scott Rasmussen using a mixed mode approach from March 18-20, 2021. Field work for the survey was conducted by RMG Research, Inc. Most respondents were contacted online or via text while 201 were contacted using automated phone polling techniques. Online respondents were selected from a list of Registered Voters and through a process of Random Digital Engagement. Certain quotas were applied, and the sample was lightly weighted by geography, gender, age, race, education, and political party to reasonably reflect the nation’s population of Registered Voters. Other variables were reviewed to ensure that the final sample is representative of that population.


Posted in Poll Results | Tagged , ,

Scott's Newsletter
Sign up for Scott's newsletter and get his political insight delivered right to your inbox!

Just 26% Believe the Right Person Was Declared Winner in Last Two Presidential Elections

Just one-out-of-four voters (26%) believe that the right person was declared the winner in each of the last two presidential elections.

Most voters (56%) believe at least one of the last two presidents was illegitimately put into office. That includes 26% who believe Hillary Clinton was the legitimate winner in 2016 and 31% who believe Donald Trump was the legitimate winner in 2020. Another 17% are not sure who really won at least one of the elections. One percent (1%) believe the wrong person was declared the winner both times.

After more than four years, most Democrats (52%) still believe that Hillary Clinton was the legitimate winner of the 2016 election. As for last November’s election, most Republicans (66%) believe Donald Trump was the legitimate winner.

In both of those elections, just 60% of voters believe that the legitimate winner became president.

SIGN UP to receive Scott’s free email newsletter.

CHECK OUT Scott’s latest polls.

Note: Neither Scott Rasmussen, ScottRasmussen.com, nor RMG Research, Inc. have any affiliation with Rasmussen Reports. While Scott Rasmussen founded that firm, he left more than seven years ago and has had no involvement since that time.

Methodology

The survey of 1,200 Registered Voters was conducted by Scott Rasmussen using a mixed mode approach from March 4-6, 2021. Field work for the survey was conducted by RMG Research, Inc. Most respondents were contacted online or via text while 237 were contacted using automated phone polling techniques. Online respondents were selected from a list of Registered Voters and through a process of Random Digital Engagement. Certain quotas were applied, and the sample was lightly weighted by geography, gender, age, race, education, and political party to reasonably reflect the nation’s population of Registered Voters. Other variables were reviewed to ensure that the final sample is representative of that population.

Posted in Poll Results | Tagged , ,

Scott's Newsletter
Sign up for Scott's newsletter and get his political insight delivered right to your inbox!

How Voters Describe Joe Biden–Results from Open End Survey Question

From January 14-16, 2021, RMG Research, Inc. asked 1,200 Registered Voters what word they would use to describe Joe Biden. As highlighted in the word clouds below, Republicans and Democrats have very different perceptions. Responses from GOP voters are shown on the left. Responses from Democratic voters are shown on the right.

Posted in Poll Results | Tagged , ,

Scott's Newsletter
Sign up for Scott's newsletter and get his political insight delivered right to your inbox!

83% of Pennsylvania Voters Say It’s Important to Reform Election Laws Prior to Next Election

Eighty-three percent (83%) of Pennsylvania voters say it’s important to reform Pennsylvania’s voting laws before the next election. A Political IQ survey found that just 11% disagree.

Those totals include 63% who say election law reform is Very Important and only 3% who say it is Not at All Important.

There’s also strong support for many specific reforms:

  • 88% agree that, prior to the election, government agencies should clean the voter registration files and remove the names of all who have moved or died.
  • 75% strongly approve of requiring all mail-in ballots to be received by Election Day.
  • 68% think government agencies should be required to report the vote totals from all ballots on Election Night.
  • 88% believe both Republican and Democratic party officials should be allowed in the room for every step of the ballot collection and ballot counting procedures.
  • 75% say all voters who cast their ballot in person should be required to show a photo ID before voting.
  • For those who mail in their ballot, 58% believe they should they required to include a copy of their photo ID.
  • 56% want ballot harvesting to be outlawed.

Additionally, 69% want mail-in ballots sent only to those who request them. Twenty-seven percent (27%) believe they should be sent to all voters.

Methodology

The online survey of 1,000 Registered Voters in Pennsylvania was conducted by Scott Rasmussen from November 16-19, 2020. Field work for the survey was conducted by RMG Research, Inc. Respondents were selected from a list of Registered Voters and through a process of Random Digital Engagement. Certain quotas were applied and the sample was lightly weighted by geography, gender, age, race, education, and political party to reasonably reflect the state’s population of Registered Voters. Other variables were reviewed to ensure that the final sample is representative of that population. Among the respondents who voted in the presidential election, 50% voted for Biden, 46% for Trump, and 3% for some other candidate. The actual vote count in Pennsylvania shows Biden at 50%, Trump at 49%, and Libertarian Jo Jorgensen at 1%. The margin of sampling error for the full sample is +/- 3.1 percentage points.


Posted in Poll Results | Tagged ,

Scott's Newsletter
Sign up for Scott's newsletter and get his political insight delivered right to your inbox!

61% Believe It Is Possible to Know Who Actually Won Close Swing State Elections

Sixty-one percent (61%) of voters nationwide believe it is possible to know for certain which candidate won the election in swing states where the election was very close. A PoliticalIQ.com survey found that 24% don’t think it’s possible while 15% are not sure.

Eighty-six percent (86%) of Democrats believe it is possible to know who won those states. Independents, by a 52% to 26% margin, agree.

However, Republicans are evenly divided. Forty-one percent (41%) believe it is possible to know and 41% say it is not.

LISTEN TO Scott’s Podcast.

SIGN UP to receive Scott’s free email newsletter.

CHECK OUT Scott’s latest polls.

Note: Neither Scott Rasmussen, ScottRasmussen.com, nor RMG Research, Inc. have any affiliation with Rasmussen Reports. While Scott Rasmussen founded that firm, he left more than seven years ago and has had no involvement since that time.

Methodology

The survey of 1,200 Registered Voters was conducted by Scott Rasmussen using a mixed mode approach from November 12-14, 2020. Field work for the survey was conducted by RMG Research, Inc. Most respondents were contacted online or via text while 276 were contacted using automated phone polling techniques. Online respondents were selected from a list of Registered Voters and through a process of Random Digital Engagement. Certain quotas were applied to the larger sample and lightly weighted by geography, gender, age, race, education, and political party to reasonably reflect the nation’s population of Registered Voters. Other variables were reviewed to ensure that the final sample is representative of that population.


Posted in Poll Results | Tagged

Scott's Newsletter
Sign up for Scott's newsletter and get his political insight delivered right to your inbox!

43% See GOP As Party Committed to Individual Freedom; 41% Say It’s the Democrats

Forty-three percent (43%) of voters nationwide believe Republicans are the political party most committed to “Individual Freedom.” A Political IQ national survey found that 41% believe it’s the Democrats. The poll, conducted by Scott Rasmussen, found that 10% don’t believe either party is committed to that ideal while 6% are not sure.

Not surprisingly, 86% of Republican voters see their party as committed to this ideal. Seventy-nine percent (79%) of Democrats say the same about their party. As for Independents, 35% pick the GOP, 30% say the Dems, and 23% neither.

Voters under the age of 35 are more likely to see the Democrats as the party of Individual Freedom. Voters over 55 take the opposite view. Those in between are evenly divided.

LISTEN TO Scott’s Podcast.

SIGN UP to receive Scott’s free email newsletter.

CHECK OUT Scott’s latest polls.

Note: Neither Scott Rasmussen, ScottRasmussen.com, nor RMG Research, Inc. have any affiliation with Rasmussen Reports. While Scott Rasmussen founded that firm, he left more than seven years ago and has had no involvement since that time.

Methodology

The survey of 1,842 Likely Voters was conducted by Scott Rasmussen using a mixed mode approach from October 23-24, 2020. Field work for the survey was conducted by RMG Research, Inc. Most respondents were contacted online or via text while 203 were contacted using automated phone polling techniques. Online respondents were selected from a list of Registered Voters and through a process of Random Digital Engagement. The Likely Voter sample was derived from a larger sample of Registered Voters using screening questions and other factors. Certain quotas were applied to the larger sample and lightly weighted by geography, gender, age, race, education, and political party to reasonably reflect the nation’s population of Registered Voters. Other variables were reviewed to ensure that the final sample is representative of that population.

Posted in Poll Results | Tagged

Scott's Newsletter
Sign up for Scott's newsletter and get his political insight delivered right to your inbox!

Election Polls 2020

Note: Neither Scott Rasmussen, ScottRasmussen.com, nor RMG Research, Inc. have any affiliation with Rasmussen Reports. While Scott Rasmussen founded that firm, he left more than seven years ago and has had no involvement since that time.

Scott Rasmussen’s final national poll, conducted October 29-31, 2020, shows former Vice President Joe Biden leading by seven points–51% to 44%. The race has been remarkably consistent. Biden has been at 51% in five consecutive weekly polls. President Trump has trailed by either seven or eight points each week. These national polls were conducted for JustTheNews.com.

SIGN UP to receive Scott’s free email newsletter.

Scott conducted just two Congressional District surveys during the election season. In Utah-4, his poll for the Deseret News showed Republican Burgess Owens with a one-point lead over incumbent Democrat Ben McAdams. In the race for Montana’s at-large seat, the was even.

Final presidential results for state polling conducted by Scott Rasmussen are summarized below:

State Biden Trump Margin Survey Dates
Florida 51 47 B+4 Oct 28-30
Michigan 51 44 B+7 Oct 27-29
Pennsylvania 51 45 B+6 Oct 25-27
North Carolina 48 47 B+1 Oct 24-26
Texas  46 50 T+4 Oct 27-28
Wisconsin 50 44 B+6 Oct 14-20
Montana 46 50 T+4 Oct 15-18
Iowa 47 47 Even Oct 15-21
Arizona 47 46 B+1 Oct 14-19
Colorado 51 43 B+8 Oct 9-15
Utah 38 50 T+12 Oct 12-17


As noted in an analysis for PoliticalIQ.com, the numbers look good for Joe Biden.

Final Senate results from Scott Rasmussen polling are summarized here

D R Spread Dates
Michigan 50 41 D+9 Oct 27-29
Texas 42 48 R+8 Oct 27-28
North Carolina 49 42 D+7 Oct 24-26
Iowa 46 43 D+3 Oct 15-21
Arizona 46 39 D+7 Oct 14-19
Colorado 51 42 D+9 Oct 9-15
Montana 47 49 R+2 Oct 15-18

LISTEN TO Scott’s Daily Podcast, “Just the Polls with Scott Rasmussen.”

Senate polls conducted by Scott Rasmussen can be found at PoliticalIQ.com.

Note: Neither Scott Rasmussen, ScottRasmussen.com, nor RMG Research, Inc. have any affiliation with Rasmussen Reports. While Scott Rasmussen founded that firm, he left more than seven years ago and has had no involvement since that time.


Posted in Poll Results | Tagged

Scott's Newsletter
Sign up for Scott's newsletter and get his political insight delivered right to your inbox!

44% of Voters Think Biden Will Win, 43% Say Trump

Forty-four percent (44%) of Likely Voters nationwide believe former Vice President Joe Biden will win the 2020 presidential election. A Political IQ national survey found that 43% believe President Trump will be re-elected.

Supporters of each candidate are very confident. Eighty-seven percent (87%) of Trump voters believe he will win. Eighty percent (80%) of Biden supporters believe their candidate will emerge victorious.

Those numbers reflect little change since the summer. In July, 91% of Trump supporters expected victory along with 80% of Biden supporters.

Polling both by Scott Rasmussen and all polling averages show Biden with a lead nationally and in key states. The fact that many Trump supporters still expect victory may result from several factors. One is the believe that the polls are simply wrong (or even fake). For many, that’s the key lesson from 2016. However, the polls weren’t as bad as the legend that has grown up around that election.

Another reason for confidence among Trump supporters may be a belief in a strong comeback or a strong Republican turnout. Political IQ polls conducted by Scott Rasmussen have shown the president trailing narrowly in Florida and North Carolina. However, in both cases, the Strong Republican turnout model shows the president ahead. In Pennsylvania, the president pulls to within two points with a Strong Republican turnout. That’s close enough to be competitive. However, President Trump would likely have to win all three to be re-elected.

LISTEN TO Scott’s Podcast.

SIGN UP to receive Scott’s free email newsletter.

CHECK OUT Scott’s latest polls.

Note: Neither Scott Rasmussen, ScottRasmussen.com, nor RMG Research, Inc. have any affiliation with Rasmussen Reports. While Scott Rasmussen founded that firm, he left more than seven years ago and has had no involvement since that time.

Methodology

The survey of 1,240 Likely Voters was conducted by Scott Rasmussen using a mixed mode approach from October 8-10, 2020. Field work for the survey was conducted by RMG Research, Inc. Most respondents were contacted online or via text while 198 were contacted using automated phone polling techniques. Online respondents were selected from a list of Registered Voters and through a process of Random Digital Engagement. The Likely Voter sample was derived from a larger sample of Registered Voters using screening questions and other factors. Certain quotas were applied to the larger sample and lightly weighted by geography, gender, age, race, education, and political party to reasonably reflect the nation’s population of Registered Voters. Other variables were reviewed to ensure that the final sample is representative of that population.

Posted in Poll Results | Tagged , ,

Scott's Newsletter
Sign up for Scott's newsletter and get his political insight delivered right to your inbox!

Generic Ballot: Democrats 46% Republicans 41%

The latest Scott Rasmussen Generic Ballot poll shows Democrats with a 5-point advantage. The survey of 941 Likely Voters found that 46% would vote for the Democrat from their District while 41% would opt for the Republican. Two percent (2%) say they’ll vote for someone else and 11% are not sure.

Republicans have a ten-point lead among White voters, but Democrats have wide margins among other voters. Seventy-four percent (74%) of Black voters prefer the Democrat. So do 67% of Hispanic voters.

Republicans have a huge lead in Rural areas and Democrats have a similar lead among Urban voters. In the suburbs, its 46% for the Democrats and 40% for Republicans.

The most recent national poll of the presidential race conducted by Scott Rasmussen shows Joe Biden with a 5-percentage point lead (48% to 43%). New results are released each Monday at JustTheNews.com.

LISTEN TO Scott’s Podcast.

SIGN UP to receive Scott’s free email newsletter.

CHECK OUT Scott’s latest polls.

Methodology

The survey of 941 Likely Voters was conducted by Scott Rasmussen using a mixed mode approach from September 10-12, 2020. Field work for the survey was conducted by RMG Research, Inc. These voters were selected from a larger sample of 1,200 Registered Voters. Likely Voters were defined as those who say they are “Definitely going to vote” or “Very Likely to Vote” and who know how they will vote.  Most respondents were contacted online or via text while 166 were contacted using automated phone polling techniques. Certain quotas were applied to the overall sample and lightly weighted by geography, gender, age, race, education, and political party to reasonably reflect the nation’s population of Registered Voters. Other variables were reviewed to ensure that the final sample is representative of that population.


Posted in Poll Results | Tagged ,

Scott's Newsletter
Sign up for Scott's newsletter and get his political insight delivered right to your inbox!

36% of Voters Say They’re Politically Conservative, 27% Say Liberal

Thirty-six percent (36%) of voters nationwide consider themselves to be politically conservative while 27% say they’re liberal. A Scott Rasmussen national survey found that 31% view themselves as moderate.

Those totals include 18% who are Very Conservative and 11% who are Very Liberal.

Seventy-five percent (75%) of Republicans are conservative while 55% of Democrats are liberal. Among Independent voters, 46% are moderate and the rest are evenly divided.

In the suburbs, 36% are conservative, 30% moderate, and 30% liberal.

In urban areas, the numbers are 34% liberal, 28% moderate, and 30% conservative.

In rural America, 40% are conservative, 37% moderate, and 13% liberal.

Data released earlier showed that 65% of voters view Donald Trump as conservative while 55% see Joe Biden as liberal.

LISTEN TO Scott’s Daily Podcast.

 SIGN UP to receive Scott’s free email newsletter.

CHECK OUT Scott’s latest polls.

FOLLOW Scott on Twitter.

ORDER Scott’s latest book: The Sun is Still Rising: Politics Has Failed But America Will Not.

Methodology

The survey of 1,200 Registered Voters was conducted by Scott Rasmussen using a mixed mode approach from August 27-29, 2020. Field work for the survey was conducted by RMG Research, Inc. Most respondents were contacted online or via text while 188 were contacted using automated phone polling techniques. Certain quotas were applied to the overall sample and lightly weighted by geography, gender, age, race, education, and political party to reasonably reflect the nation’s population of Registered Voters. Other variables were reviewed to ensure that the final sample is representative of that population.

Posted in Poll Results | Tagged

Scott's Newsletter
Sign up for Scott's newsletter and get his political insight delivered right to your inbox!

55% See Biden As Politically Liberal; 65% Say Trump’s Conservative

Fifty-five percent (55%) of voters nationwide see Joe Biden as politically liberal while 20% say he’s a moderate. A Scott Rasmussen national survey also found that 13% consider the former Vice President to be politically conservative while another 13% are not sure.

As for President Trump, 65% view him as conservative, 11% say moderate, 7% liberal, and 16% are not sure.

Republican voters draw clearer ideological contrasts than other voters. Eighty-one percent (81%) of Republicans see Trump as a conservative while 74% see Biden as a liberal. Among Democrats, 60% see Trump as conservative and 46% view Biden as liberal.

When it comes to the Vice Presidential running mates, the numbers for Senator Kamala Harris is viewed in almost identical ideological terms as Biden. That’s not surprising, especially given that all many voters know about Harris is that Biden selected her for the ticket. It is possible, though far from certain, that voters may begin to see Harris in a different ideological light between now and November.

On the other hand, Vice President Mike Pence is seen as a bit more conservative than President Trump. Fifty-two percent (52%) of voters see Pence as Very Conservative. Just 40% say the same about Trump. The perspective that Pence is more conservative than Trump is shared by Republicans, Democrats, and Independents.

LISTEN TO Scott’s Daily Podcast.

 SIGN UP to receive Scott’s free email newsletter.

CHECK OUT Scott’s latest polls.

FOLLOW Scott on Twitter.

ORDER Scott’s latest book: The Sun is Still Rising: Politics Has Failed But America Will Not.

Methodology

The survey of 1,200 Registered Voters was conducted by Scott Rasmussen using a mixed mode approach from August 27-29, 2020. Field work for the survey was conducted by RMG Research, Inc. Most respondents were contacted online or via text while 188 were contacted using automated phone polling techniques. Certain quotas were applied to the overall sample and lightly weighted by geography, gender, age, race, education, and political party to reasonably reflect the nation’s population of Registered Voters. Other variables were reviewed to ensure that the final sample is representative of that population.

Posted in Poll Results | Tagged ,

Scott's Newsletter
Sign up for Scott's newsletter and get his political insight delivered right to your inbox!

45% Think Biden Will Win in November, 40% Say Trump

Regardless of who they want to win in November, 45% of Registered Voters nationwide believes that Democrat Joe Biden will emerge victorious. A Scott Rasmussen national survey found that 40% disagree and believe Republican Donald Trump will be the victor. Two percent (2%) think someone else will win it all while 12% are not sure.

The survey was conducted after the Democratic National Convention and before the Republican National Convention.

Looking back, responses have been trending in Biden’s direction for some time. Last year, a majority of voters expected Trump to be re-elected. That was before the pandemic and the lockdowns. In late June, voters were evenly divided about who would win–42% picked Biden and 42% Trump.

Eight-out-of-ten Democrats expect Biden to win while eight-out-of-ten Republicans expect Trump to be re-elected. Among unaffiliated voters, 39% pick Biden and 35% Trump.

We will repeat the question next week to see if there is any impact from the GOP convention.

LISTEN TO Scott’s Podcast.

SIGN UP to receive Scott’s free email newsletter.

CHECK OUT Scott’s latest polls.

Methodology

The survey of 1,200 Registered Voters was conducted by Scott Rasmussen using a mixed mode approach from August 20-22, 2020. Field work for the survey was conducted by RMG Research, Inc. Most respondents were contacted online or via text while 142 were contacted using automated phone polling techniques. Certain quotas were applied to the overall sample and lightly weighted by geography, gender, age, race, education, and political party to reasonably reflect the nation’s population of Registered Voters. Other variables were reviewed to ensure that the final sample is representative of that population.


Posted in Poll Results | Tagged , ,

Scott's Newsletter
Sign up for Scott's newsletter and get his political insight delivered right to your inbox!

Biden 45% Trump 37% Jorgensen 2% Hawkins 1%

The latest Scott Rasmussen national survey of 1,200 Registered Voters shows Joe Biden leading Donald Trump by eight points– 45% to 37%. That’s little changed from a month ago.

The survey also found that 2% would vote for Libertarian candidate Jo Jorgensen and 1% for Green Party candidate Howie Hawkins. This is the first time they’ve been included in a Scott Rasmussen national poll.

Three percent (3%) would cast their ballot for some other candidate and 12% are not sure.

Biden leads by four points among private sector workers and 30% among government employees.

Among White voters, the president holds a narrow lead: 44% to 38%. However, he attracts support from only 8% of Black voters and 22% of Hispanic voters.

Many voters dismiss polls they don’t like because they are convinced the polls were wrong in 2016. Actually, the polls were pretty good. However, the analysis and interpretation of those polls was horrible.

Neither Scott Rasmussen, ScottRasmussen.com, nor RMG Research, Inc. have any connection or relationship with Rasmussen Reports. Scott Rasmussen left that firm more than seven years ago and has had no involvement with it since then.

LISTEN TO Scott’s Podcast.

SIGN UP to receive Scott’s free email newsletter.

CHECK OUT Scott’s latest polls.

Methodology

The survey of 1,200 Registered Voters was conducted by Scott Rasmussen using a mixed mode approach from July 23-25, 2020. Field work for the survey was conducted by RMG Research, Inc. Most respondents were contacted online or via text while 161 were contacted using automated phone polling techniques. Certain quotas were applied to the overall sample and lightly weighted by geography, gender, age, race, education, and political party to reasonably reflect the nation’s population of Registered Voters. Other variables were reviewed to ensure that the final sample is representative of that population.

Posted in Poll Results | Tagged , ,

Scott's Newsletter
Sign up for Scott's newsletter and get his political insight delivered right to your inbox!

27% View Economy, Health Care as Top Voting Issues

Twenty-seven percent (27%) of voters name the economy as the top voting issue in the upcoming presidential election. A JustTheNews.com survey conducted by Scott Rasmussen found that an identical number–27%– say health care is the top issue.

Those numbers reflect a growing concern about health care over the past month. In June, a Ballotpedia survey found that 30% named the economy as most important while just 17% said health care.  That’s a 10 point gain in the importance of health care.

For Independent voters, health care is now the top issue. A month ago, they were more concerned about the economy.

Currently, 12% say Law and Order is the top issue, little changed from a month ago.

Eleven percent (11%) now see Civil Rights as the top issue, down five points from last month.

 Overall, in naming the top issue, voters are evenly divided between issues that generally favor Democrats (health care, Civil Rights, income inequality, and the environment) and those that generally favor Republicans (economy, law and order, immigration, and freedom of speech). However, while the Republicans started the year with a clear advantage on the economy, that has faded amidst the pandemic lockdowns.

Posted in Poll Results | Tagged , ,

Scott's Newsletter
Sign up for Scott's newsletter and get his political insight delivered right to your inbox!

47% Say Supreme Court Nominations Are Very Important Voting Issue

Forty-seven percent (47%) of voters nationwide say that Supreme Court nominations will be a Very Important voting issue in terms of deciding their vote for President. A Scott Rasmussen national survey found that total includes 56% of Democrats, 48% of Republicans, and 35% of those not affiliated with either major party.

Still, despite the significance of the Supreme Court, five other issues were seen as Very Important by a larger number of voters. Seventy-three percent (73%) consider health care to be a Very Important voting issue while 67% say the same about the economy. Close behind, 64% say Civil Rights issues are Very Important while an identical number say Law and Order is that important. Immigration is seen as Very Important by 53% of voters.

On most of the issues, there is little difference between the views of those who are out working and those who are not interacting with customers or co-workers. However, there is a substantial divide on the issue of law and order. Among those workers who regularly interact with both customers and co-workers, 78% say Law and Order is a Very Important Issue. Among those who are not interacting with others, just 49% hold that view.

Methodology

The online survey of 1,000 Registered Voters was conducted by Scott Rasmussen on June 20, 2020. Field work for the survey was conducted by RMG Research, Inc.  Certain quotas were applied to the overall sample and lightly weighted by geography, gender, age, race, education, and political party to reasonably reflect the nation’s population of Registered Voters. Other variables were reviewed to ensure that the final sample is representative of that population.

Posted in Poll Results | Tagged ,

Scott's Newsletter
Sign up for Scott's newsletter and get his political insight delivered right to your inbox!

39% Trust Democrats on Economy, 38% Trust Republicans

When it comes to the economy, voters are evenly divided as to which party they trust more. A Ballotpedia national survey found that 39% trust Democrats more while 38% trust the GOP. The survey of 1,000 Registered Voters also found that 14% don’t trust either party and 9% are not sure.

There is an interesting gap among working Americans based upon how they are currently working. Those workers who have no personal interaction with either customers or co-workers trust Democrats more than Republicans by a 45% to 27% margin. However, among those who regularly have in-person contact with both customers and co-workers, the opposite is true. Fifty-two percent (52%) of those who are out working trust Republicans more while just 34% have more confidence in Democrats.

Ballotpedia will continue to explore the gap between these groups of workers in the coming weeks.


Posted in Poll Results | Tagged ,

Scott's Newsletter
Sign up for Scott's newsletter and get his political insight delivered right to your inbox!

Economy, Health Care, Civil Rights Top Three Voting Issues

Thirty percent (30%) of voters nationwide rate the economy as the top issue facing the nation today. A Ballotpedia national survey found that 17% view health care as most important, 16% name Civil Rights and 11% say Law and Order. No other issue reaches double digit support at this time.

Other polling has shown that health care and the economy have been top issues for years. However, both terms have taken on a different tone in the coronavirus pandemic era.

When it comes to issue priorities, there are significant partisan and demographic differences.

Civil Rights is the top issue for 24% of Democrats. Twenty-three percent (23%) say healthcare and 20% name the economy as most important.

For Republicans, the economy is far and away the top issue. Forty-one percent (41%) of GOP voters consider it most important followed by Law and Order (20%) and healthcare (13%).

Among Independents, the economy is number one (30%). That parallels the Republican view. However, unlike Republicans, number two on the list for Independents is the issue of Civil Rights(15%).

Voters under 35 see Civil Rights as most important. Older voters place a higher priority on the economy and health care.

Among black voters, Civil Rights is number one. Among white and Hispanic voters, the economy is seen as a top priority.

LISTEN TO Scott’s Daily Podcast, “Scott Rasmussen’s Number of the Day.”

SIGN UP to receive Scott’s free email newsletter.

CHECK OUT Scott’s latest polls.

Methodology

The survey of 1,200 Registered Voters was conducted by Scott Rasmussen using a mixed mode approach from June 11-13, 2020. Field work for the survey was conducted by RMG Research, Inc. Most respondents were contacted online or via text while 306 were contacted using automated phone polling techniques. Certain quotas were applied, and the overall sample was lightly weighted by geography, gender, age, race, education, and political party to reasonably reflect the nation’s population of Registered Voters. Other variables were reviewed to ensure that the final sample is representative of that population.


Posted in Poll Results | Tagged , , ,

Scott's Newsletter
Sign up for Scott's newsletter and get his political insight delivered right to your inbox!

22% Don’t Think It Matters Whether Biden or Trump Wins

Twenty-two percent (22%) of Registered Voters don’t think it matters much whether Donald Trump or Joe Biden wins the presidential election in November. A Scott Rasmussen national survey found that total includes 11% who say it won’t make any real difference in their life and 11% who aren’t sure if it will make a difference.

On top of that, another 17% say it will make only a minor difference.

That leaves 62% of voters who believe the outcome of the election will make a major difference in their life.

Seventy-two percent (72%) of Trump voters say it will make a major difference along with 68% of Biden voters.

However, among those who say they’d vote for some other candidate, 53% don’t think it will make a difference and another 20% say it would make just a minor difference.

As for undecided voters, 74% say it won’t make a difference in their lives and another 15% expect only a minor difference.

SIGN UP to receive Scott’s free email newsletter.

CHECK OUT Scott’s latest polls.

Methodology

The survey of 1,200 Registered Voters was conducted by Scott Rasmussen using a mixed mode approach from June 4-6, 2020. Field work for the survey was conducted by RMG Research, Inc. Most respondents were contacted online or via text while 246 were contacted using automated phone polling techniques. Certain quotas were applied, and the overall sample was lightly weighted by geography, gender, age, race, education, and political party to reasonably reflect the nation’s population of Registered Voters. Other variables were reviewed to ensure that the final sample is representative of that population.

Posted in Poll Results | Tagged , ,

Scott's Newsletter
Sign up for Scott's newsletter and get his political insight delivered right to your inbox!

Generic Ballot: Democrats 43% Republicans 36%

April 29, 2020–If the election for Congress were held today, 43% of voters nationwide say they would vote for the Democrat from their district while 36% would vote for the Republican. A Scott Rasmussen national survey found that 4% would prefer some other candidate and 18% are not sure.

Republicans lead by six points among men, Democrats by 20 among women.

Last month, a Generic Ballot survey conducted  by Scott Rasmussen found Democrats with a nine-point lead: 48% to 39%. Last week, the numbers showed the Democrats with an 11-point advantage on the Generic Congressional Ballot: 46% to 35%. It is possible that the numbers are shifting due to the dynamics of the pandemic and other issues. However, it is perhaps even more likely that these shifts reflect little more than statistical noise. Compared to the data from March, last week’s results showed the Democratic lead 2 points higher and this week’s numbers show that lead to be 2-points smaller.

All the results are similar to the actual eight point advantage the Democrats won in the 2018 mid-term elections.

SIGN UP to receive Scott’s free email newsletter.

CHECK OUT Scott’s latest polls.


The survey of 1,200 Registered Voters was conducted by Scott Rasmussen using a mixed mode approach from April 23-25, 2020. Field work for the survey was conducted by RMG Research, Inc. Most respondents were contacted online while 272 were contacted using automated phone polling techniques. Certain quotas were applied to the overall sample and lightly weighted by geography, gender, age, race, and political party to reasonably reflect the nation’s population of Registered Voters. Other variables were reviewed to ensure that the final sample is representative of that population.

Posted in Poll Results | Tagged

Scott's Newsletter
Sign up for Scott's newsletter and get his political insight delivered right to your inbox!

Generic Ballot: Democrats 46% Republicans 35%

Democrats currently enjoy an 11-point advantage on the Generic Congressional Ballot.

The latest Scott Rasmussen national survey shows that 46% of voters would cast their ballot for the Democrat from their District while 35% prefer the Republican. Four percent (4%) would prefer some other candidate and 15% are not sure.

Among those most interested in the election–and presumably the most likely to vote–the race is a bit closer. Among these voters, the Democrats enjoy a seven-point advantage (48% to 41%).

In the key demographic group of suburban women, Democrats lead by a 51% to 31% margin.

A Generic Ballot survey conducted last month by Scott Rasmussen found Democrats with a nine-point lead: 48% to 39%.


The survey of 1,200 Registered Voters was conducted by Scott Rasmussen using a mixed mode approach from April 16-18, 2020. Field work for the survey was conducted by RMG Research, Inc. Most respondents were contacted online while 167 were contacted using automated phone polling techniques. Certain quotas were applied to the overall sample and lightly weighted by geography, gender, age, race, and political party to reasonably reflect the nation’s population of Registered Voters. Other variables were reviewed to ensure that the final sample is representative of that population.

Posted in Uncategorized | Tagged

Scott's Newsletter
Sign up for Scott's newsletter and get his political insight delivered right to your inbox!

The Polls Weren’t Wrong in 2016–But The Analysis of the Polls Was Horrible

Contrary to popular myths, the national political polls in 2016 were very accurate. According to the Real Clear Politics average, Hillary Clinton was projected to win the popular vote by 3.3 percentage points and she actually won it by 2.1 percentage points. Ten of the last twelve national polls released were within two percentage points of the actual margin. One of the others overestimated Clinton’s margin by four points and one underestimated it by four points.

That’s about as accurate a projection as you could hope for!

However, while the polling was good, the analysis of the polling was not.

Many in the media and political worlds simply could not imagine a Clinton loss. Some looked at the polling, noted the margin of error, and assumed the Democratic nominee would win by far more than three percentage points. Some thought she could win a few traditionally Republican states while few imagined the reverse could happen.

The problem was not the polls, but the analysis.

This failure of polling analysis was not supported by the underlying data. Heading into Election Day, the Real Clear Politics projections showed that Clinton was clearly favored to win just 203 of the needed 270 Electoral College votes. Donald Trump was favored to win 164 and an astounding 171 were in the Toss-Up category. Reviewing the toss-up states at that time, I noted publicly that it was fairly easy to envision how Trump could reach 263 Electoral College votes.

That reality should have dented the overwhelming confidence of a Clinton victory expressed in the media and political worlds. Polling data showed a race close enough that a surprise in a single traditionally Democratic state could elect Donald Trump. But that possibility was largely ignored in media coverage of the race.

On Election Day, of course, then-candidate Trump stunned the political world by capturing three traditionally Democratic states: Pennsylvania, Michigan, and Wisconsin. Once again, the surprise was more a failure of analysis than public polling. In Pennsylvania, the polling averages showed Clinton ahead by just 1.9 percentage points. In Michigan, she was up just 3.4 points. Both results were clearly in toss-up range. Additionally, in both states, the final public poll released showed Trump ahead.

The only true polling misfire was in Wisconsin, where Clinton was projected to win by 6.5 percentage points and Trump won by just under a point.

The bottom line is that the actual public polling in 2016 was far better than the pundit’s analysis of that polling data.

Posted in Deeper Currents | Tagged ,

Scott's Newsletter
Sign up for Scott's newsletter and get his political insight delivered right to your inbox!

Biden 45% Trump 40%

If the presidential election were held today, 45% of Registered Voters would vote for Democrat Joe Biden while 40% prefer Republican Donald Trump.

However, the survey conducted by Scott Rasmussen found that 70% of Trump’s supporters have a high level of interest in the election.  Just 61% of Biden’s voters say the same. Among those who have a high level of interest–and are most likely to vote–it’s Biden 47% Trump 46%.

Among all Registered voters living in Urban areas, Biden leads by a 60% to 23% margin. Trump leads by 19 points (50% to 31%) among Rural voters. The candidates are essential tied among Suburban voters with Biden at 44% and Trump at 43%.

Among Suburban voters with a high level of interest in the election, it’s Trump 48% Biden 47%. Biden’s margin among Urban voters slips to 32 points among those with a high level of interest (61% to 29%). Trump’s lead among interested Rural voters increases to 32 points (62% to 30%).

The survey also explored attitudes on the coronavirus pandemic.

On just about every question there is a wide partisan divide.

To receive the latest numbers and insights from Scott, sign up for his free newsletter.

The survey of 1,000 Registered Voters was conducted by Scott Rasmussen using a mixed mode approach from March 26-28, 2020. Field work for the survey was conducted by RMG Research, Inc. Approximately 72% of the survey respondents were selected at random from lists of Registered Voters. The remainder were selected through Random Digital Engagement. Most were contacted online while 247 were contacted using automated phone polling techniques. Certain quotas were applied to the overall sample and lightly weighted by gender, age, race, and political party to reasonably reflect the nation’s population of Registered Voters. Other variables were reviewed to ensure that the final sample is representative of that population.

Posted in Poll Results | Tagged , ,

Scott's Newsletter
Sign up for Scott's newsletter and get his political insight delivered right to your inbox!