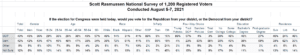
If the election were held today, 42% of Registered Voters would vote for the Democrat from their Congressional District while 40% would vote for the Republican. Those numbers are little changed since mid-July. In fact, the numbers have held steady for months.
Democrats enjoy a massive 62% to 24% advantage among urban voters. Republicans lead by 8 percentage points among suburban voters and by 13 among rural voters.
Not surprisingly, voters are also divided as to who they trust on election reform issues. Thirty-six percent (36%) trust the Democrats, 32% trust the GOP, and 22% don’t trust either party.
Other data highlights several challenges facing the Democrats as they look to the midterms.
Given a choice, 68% of voters prefer a Congressional candidate who believed that all voters should be required to show photo ID before casting a ballot. Just 19% would cast their ballot for a candidate who voted to ban the use of photo ID requirements. That ban is included in the “For the People Act,” legislation supported by virtually every Democrat in Congress.
That legislation also runs afoul of the strong public support for having all mail-in ballots received by Election Day.
On the economic front, the collapse in confidence concerning the pandemic has not dented public perceptions of their personal finances. However, despite assurances to the contrary, 61% of voters believe the Biden Administration will raise taxes on the middle class. Additionally, 59% believe an increase in government spending leads to inflation.
SIGN UP to receive Scott’s free email newsletter.
CHECK OUT Scott’s latest polls.
Note: Neither Scott Rasmussen, ScottRasmussen.com, nor RMG Research, Inc. have any affiliation with Rasmussen Reports. While Scott Rasmussen founded that firm, he left more than seven years ago and has had no involvement since that time.
Methodology
The survey of 1,200 Registered Voters was conducted by Scott Rasmussen using a mixed mode approach from August 5-7, 2021. Field work for the survey was conducted by RMG Research, Inc. Most respondents were contacted online or via text while 236 were contacted using automated phone polling techniques. Online respondents were selected from a list of Registered Voters and through a process of Random Digital Engagement. Certain quotas were applied, and the sample was lightly weighted by geography, gender, age, race, education, internet usage, and political party to reasonably reflect the nation’s population of Registered Voters. Other variables were reviewed to ensure that the final sample is representative of that population.