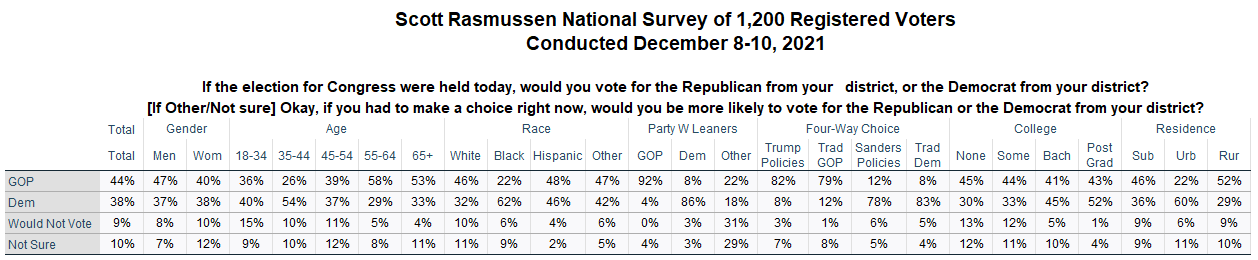
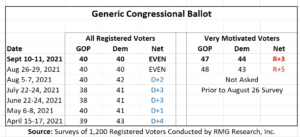
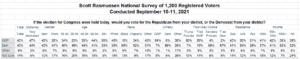
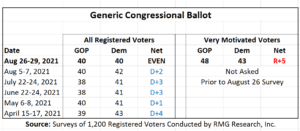
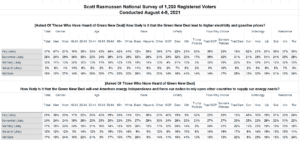
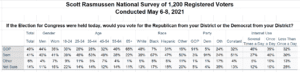
Republicans have opened a six point lead on the Generic Congressional Ballot. The latest Scott Rasmussen national survey found that 44% of Registered Voters would currently vote for the Republican from their district while 38% would vote for the Democrat. Nine percent (9%) would not vote and 10% are not sure.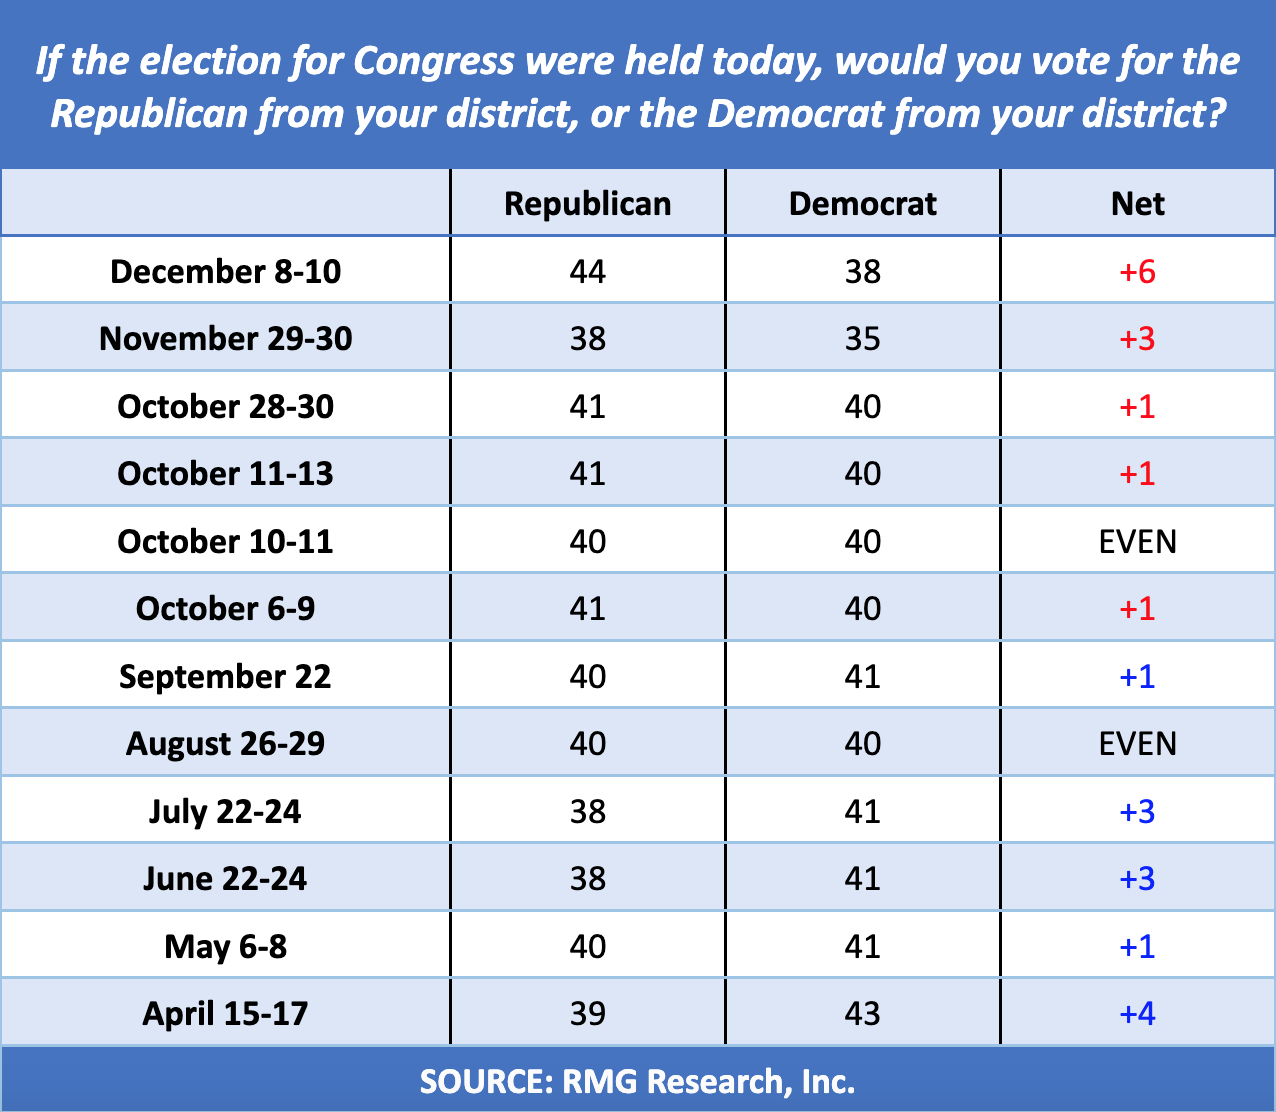
This is the first Scott Rasmussen survey of the 2022 cycle to include “leaners.” Those are people who initially express no preference for either party. However, on a follow-up question, they indicate a preference if they had to make a choice right now.
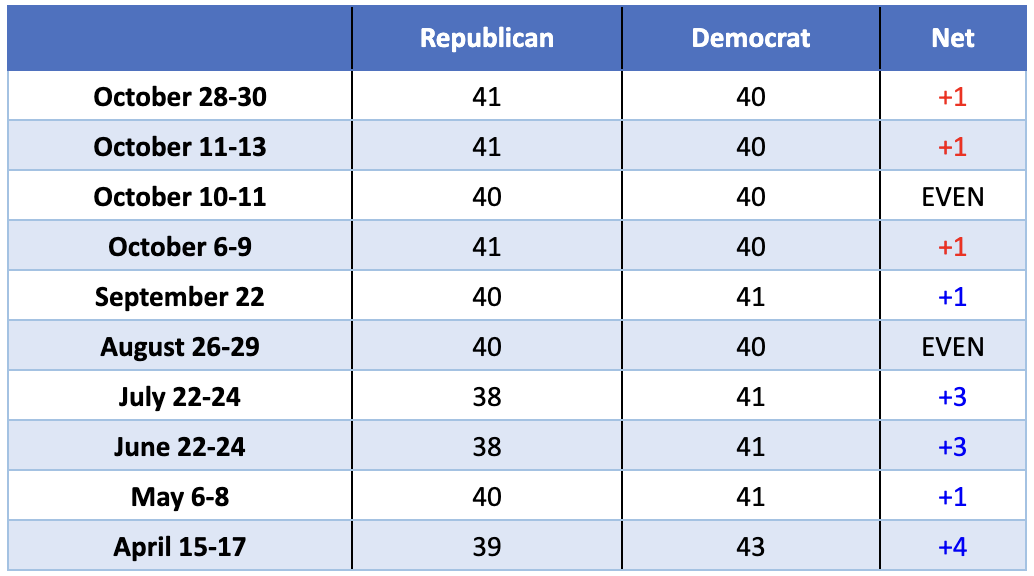
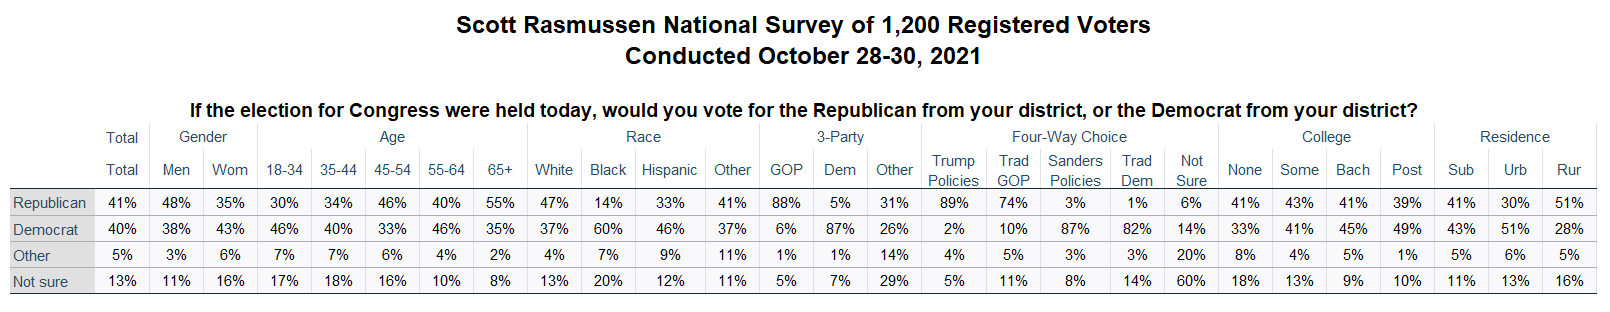
Without leaners, the Republican advantage on this latest survey was three percentage points (38% to 35). That’s unchanged from late November, but up two since late October.
The trend throughout 2022 has clearly favored the GOP. In Scott Rasmussen’s April survey, Democrats enjoyed a four-point advantage. However, President Biden’s party has not led since September.
This trend is consistent with the ongoing series of party affiliation data tracked by Gallup. In April, Democrats had a five-point advantage. The latest numbers, from November, show a nine-point swing in favor of the GOP. Currently, 31% of adults identify with the Republicans while 27% consider themselves Democrats.
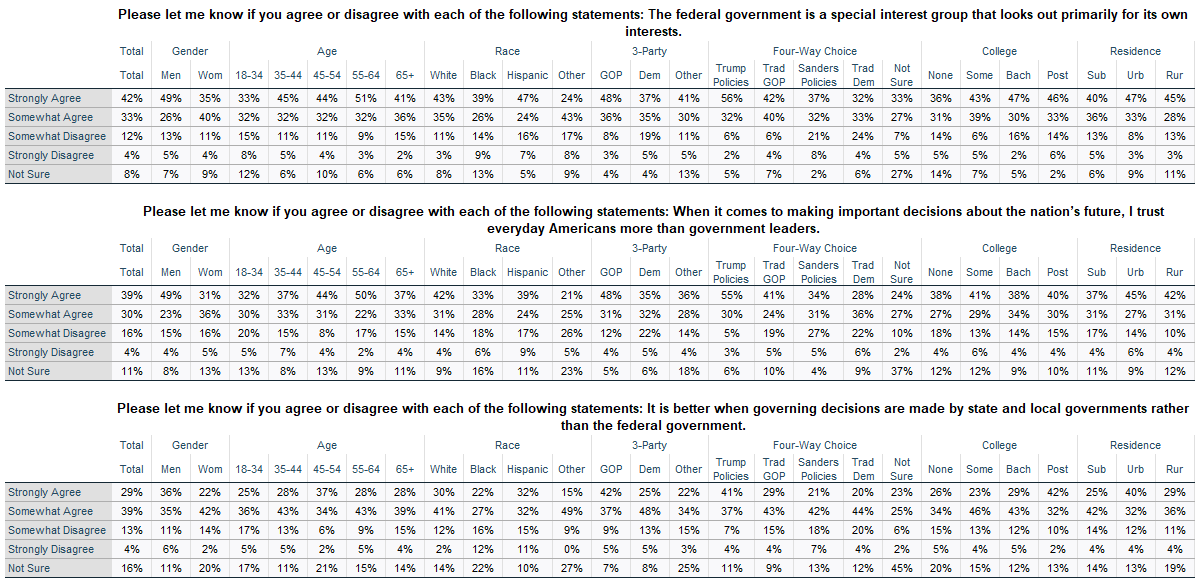
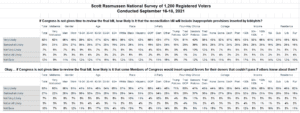
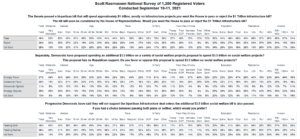
The decline in support for Democrats likely has many causes. In terms of legislation, the president’s Build Back Better plan is weighed down by a large number of extraordinarily unpopular provisions. Additionally, Democrats are seen as a bigger threat to democracy than Republicans. In their push for election reform, Democrats have sought legislation to outlaw three election reforms that are supported by more than 80 percent of voters.
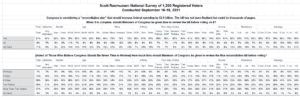
Beyond specific legislation, there are many broader concerns. Most voters recognize that, compared to pre-pandemic numbers, there are far fewer Americans with a job these days. Politically, this is a very challenging issue for Democrats. Two-thirds of voters say economic issues are more important than cultural issues. Yet only 37% believe that Democratic politicians and activists are primarily interested in economic issues.
SIGN UP to receive Scott’s free email newsletter.
CHECK OUT Scott’s latest polls.
Note: Neither Scott Rasmussen, ScottRasmussen.com, nor RMG Research, Inc. have any affiliation with Rasmussen Reports. While Scott Rasmussen founded that firm, he left more than seven years ago and has had no involvement since that time.
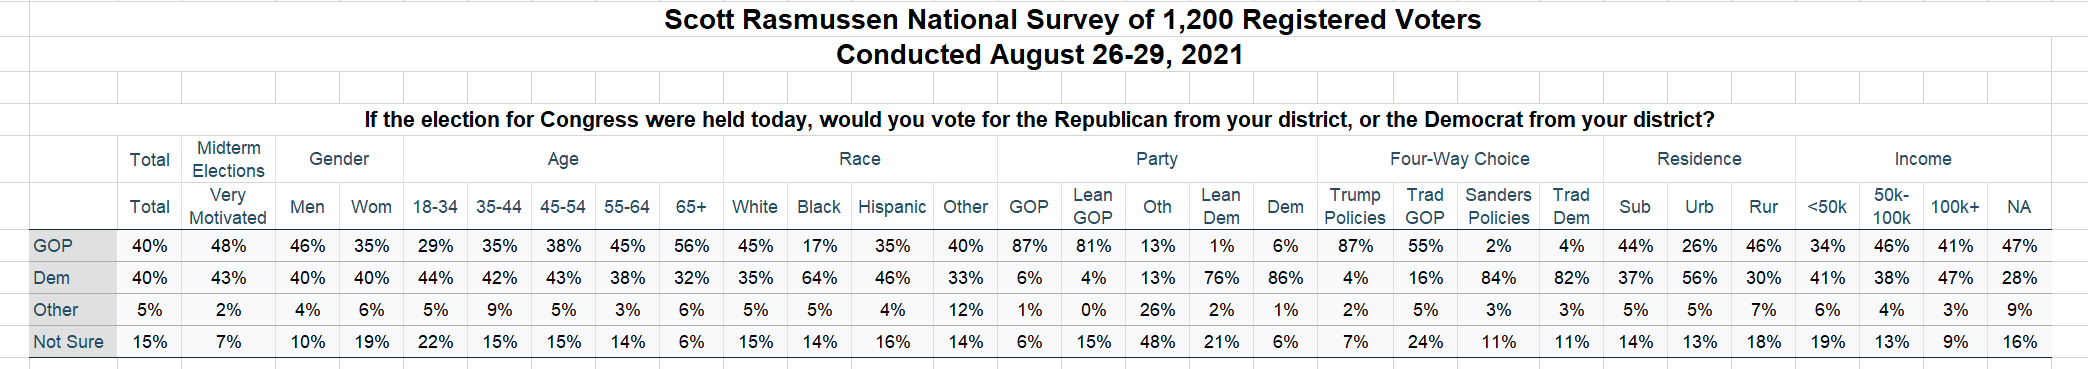
Question:
If the election for Congress were held today, would you vote for the Republican from your district, or the Democrat from your district? [If “Other”/”Not sure”] Okay, if you had to make a choice right now, would you be more likely to vote for the Republican or the Democrat from your district?
44% Republican
38% Democrat
9% Would not vote
10% Not sure
Methodology
The survey of 1,200 Registered Voters was conducted online by Scott Rasmussen on December 8-10, 2021. Field work for the survey was conducted by RMG Research, Inc. Certain quotas were applied, and the sample was lightly weighted by geography, gender, age, race, education, internet usage, and political party to reasonably reflect the nation’s population of Registered Voters. Other variables were reviewed to ensure that the final sample is representative of that population.