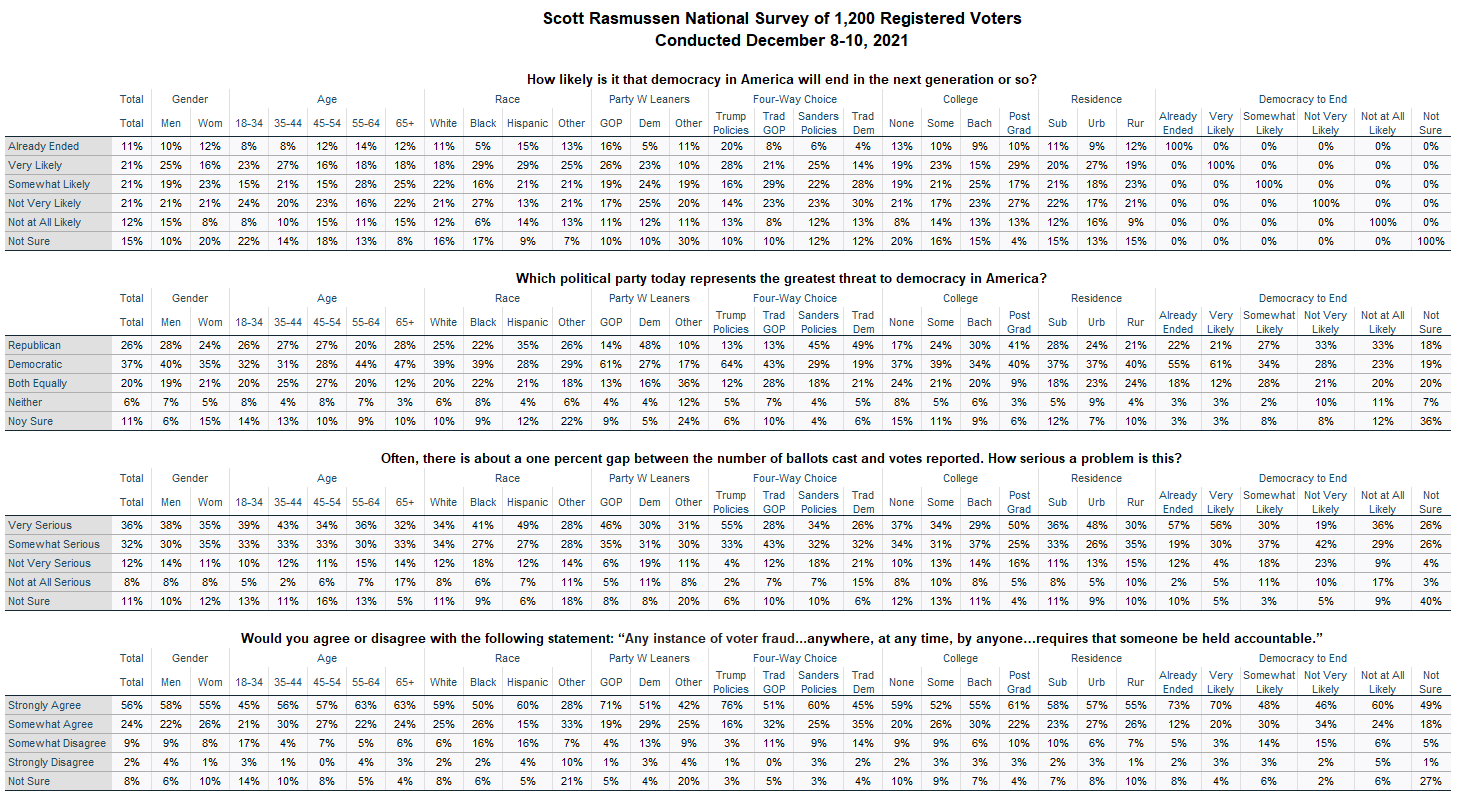
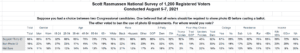
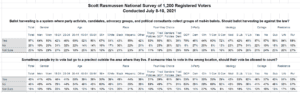
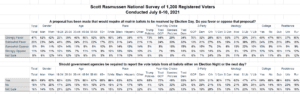
Thirty-two percent (32%) of voters think it’s Very Likely that democracy in America will end in the next generation or so. A Scott Rasmussen national survey found that total includes 11% who believe it has already ended.
Another 21% say democracy is somewhat likely to end over the next generation, 33% say it’s not likely to happen, and 15% are not sure.
Republicans are significantly more worried about democracy ending than Democrats. Forty-two percent (42%) of GOP voters think it is Very Likely to end over the next generation. Just 28% of those in President Biden’s party share that view.
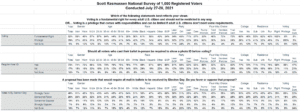
Thirty-seven percent (37%) of all voters see Democrats as a bigger threat to democracy than Republicans. Twenty-six percent (26%) see Republicans as the bigger threat while 20% think the two parties represent an equal threat to democracy.
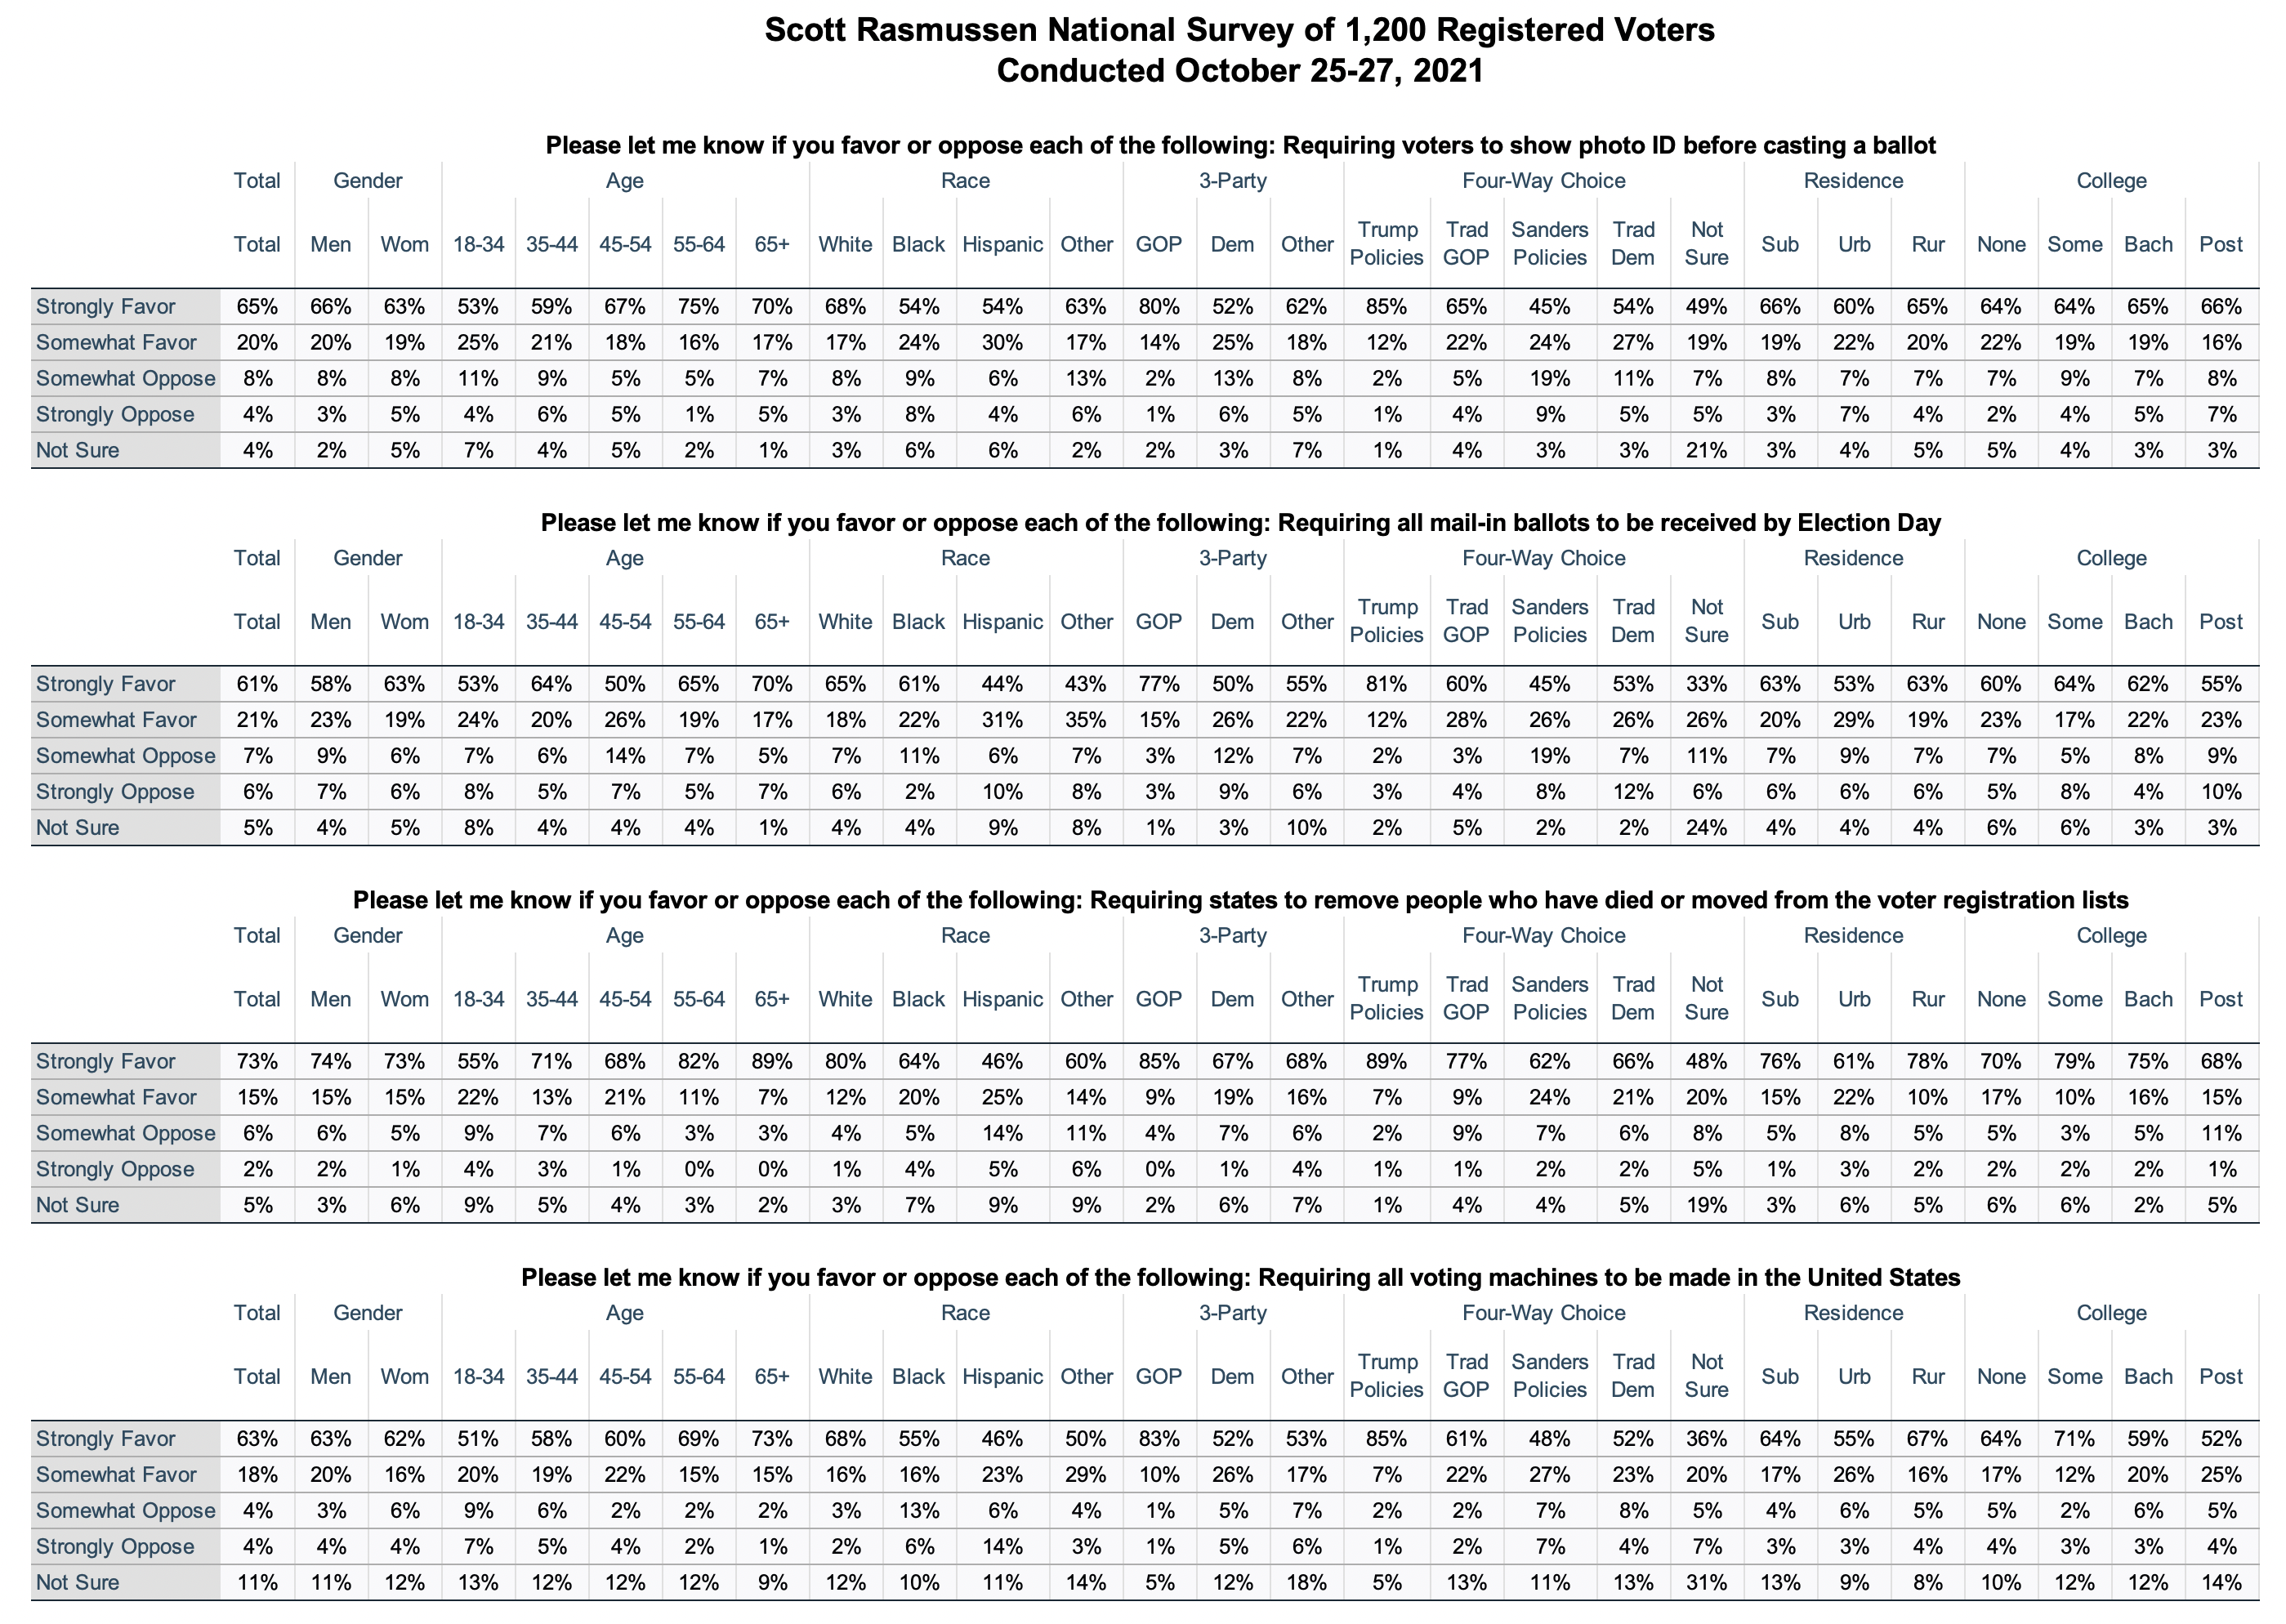
One reason a plurality of voters see Democrats as the bigger threat may be that they are actively promoting legislation to outlaw three election reforms that are supported by more than 80 percent of voters. The effort by Congressional Democrats to outlaw photo ID requirements is especially significant.
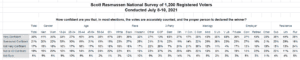
But the challenges run much deeper than simply election laws. Data released earlier showed that 55% of voters believe letting government bureaucrats set rules without approval of Congress or voters is a major threat to democracy. Rather than a public service responding to voters, 73% see the federal government is a special interest group that looks out primarily for its own interests. Forty-five percent (45%) see the January 6 assault on the U.S. Capitol as a major threat to democracy.
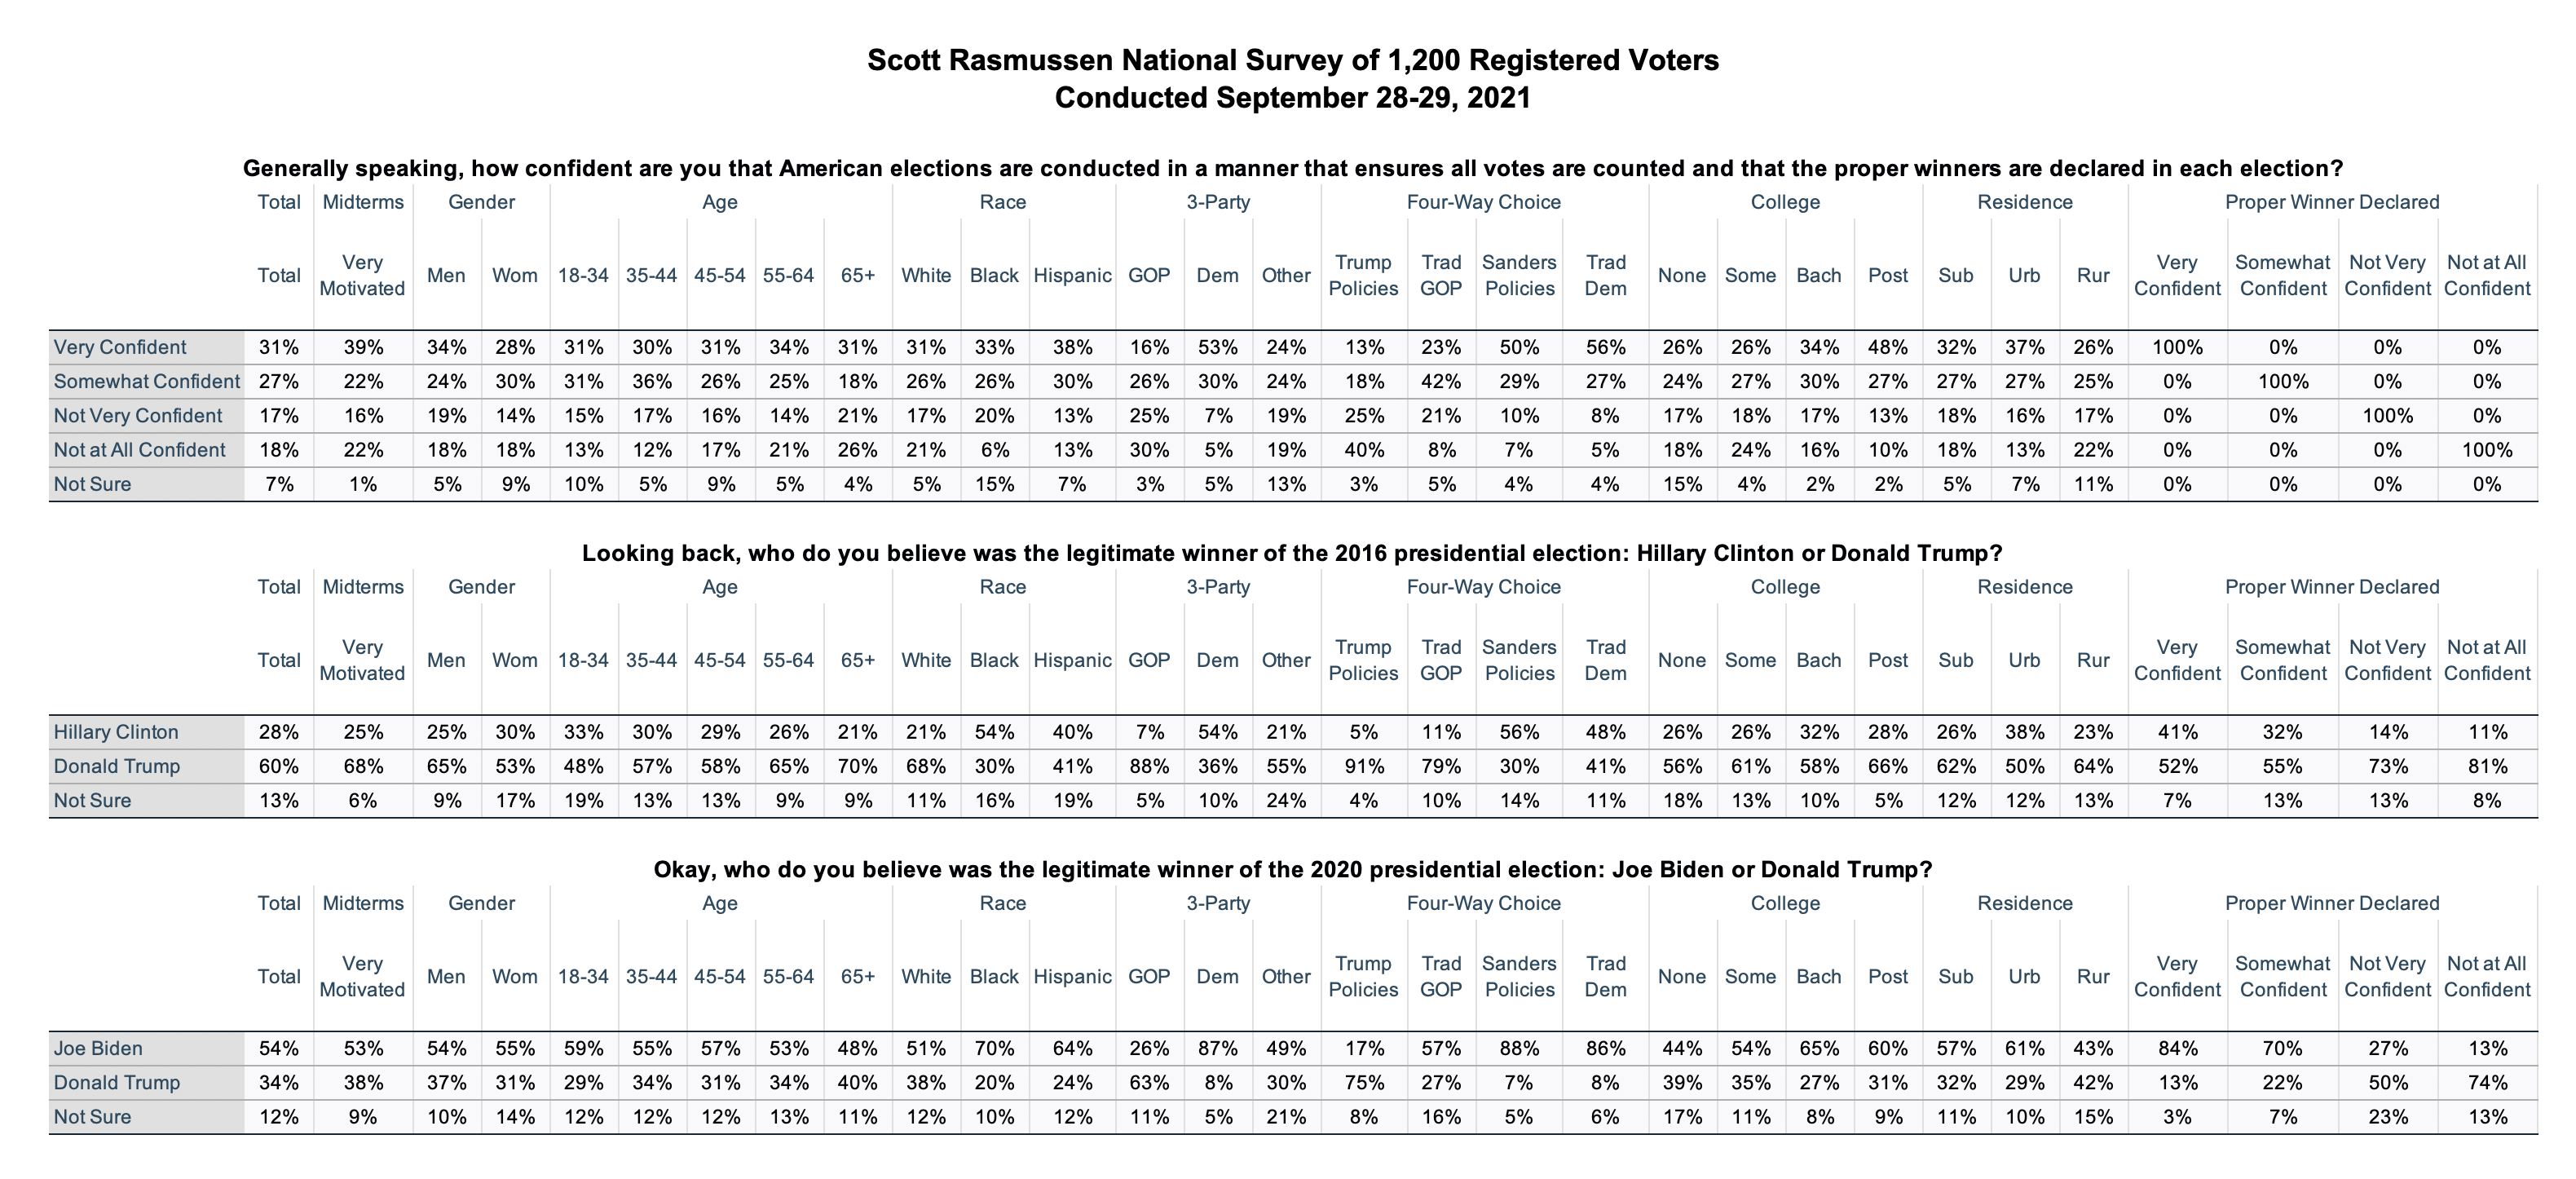
Fifty-eight percent (58%) of voters are confident that American elections are conducted in a manner that ensures all votes are counted and that the proper winners are declared. Most Democrats (54%) continue to believe that Hillary Clinton was the legitimate winner of the 2016 presidential election. Most Republicans (63%) believe that Donald Trump was the legitimate winner in 2020.
The latest survey also found 68% believe even small discrepancies in vote counts represent a serious problem. Eighty percent (80%) agree that “Any instance of voter fraud…anywhere, at any time, by anyone…requires that someone be held accountable.”
SIGN UP to receive Scott’s free email newsletter.
CHECK OUT Scott’s latest polls.
Note: Neither Scott Rasmussen, ScottRasmussen.com, nor RMG Research, Inc. have any affiliation with Rasmussen Reports. While Scott Rasmussen founded that firm, he left more than seven years ago and has had no involvement since that time.
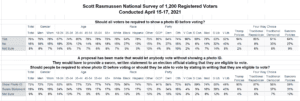
Question 1:
How likely is it that democracy in America will end in the next generation or so?
11% It has already ended
21% Very likely
21% Somewhat likely
21% Not very likely
12% Not at all likely
15% Not sure
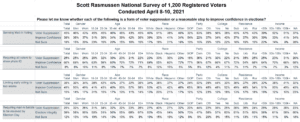
Question 2:
Which political party today represents the greatest threat to democracy in America?
26% Republican
37% Democratic
20% Both equally
6% Neither
11% Not sure
Question 3:
Often, there is about a one percent gap between the number of ballots cast and votes reported. How serious a problem is this?
36% Very serious
32% Somewhat serious
12% Not very serious
8% Not at all serious
11% Not sure
Question 4:
Would you agree or disagree with the following statement: “Any instance of voter fraud…anywhere, at any time, by anyone…requires that someone be held accountable.”
56% Strongly agree
24% Somewhat agree
9% Somewhat disagree
2% Strongly disagree
8% Not sure
Methodology
The survey of 1,200 Registered Voters was conducted online by Scott Rasmussen on December 8-10, 2021. Field work for the survey was conducted by RMG Research, Inc. Certain quotas were applied, and the sample was lightly weighted by geography, gender, age, race, education, internet usage, and political party to reasonably reflect the nation’s population of Registered Voters. Other variables were reviewed to ensure that the final sample is representative of that population.