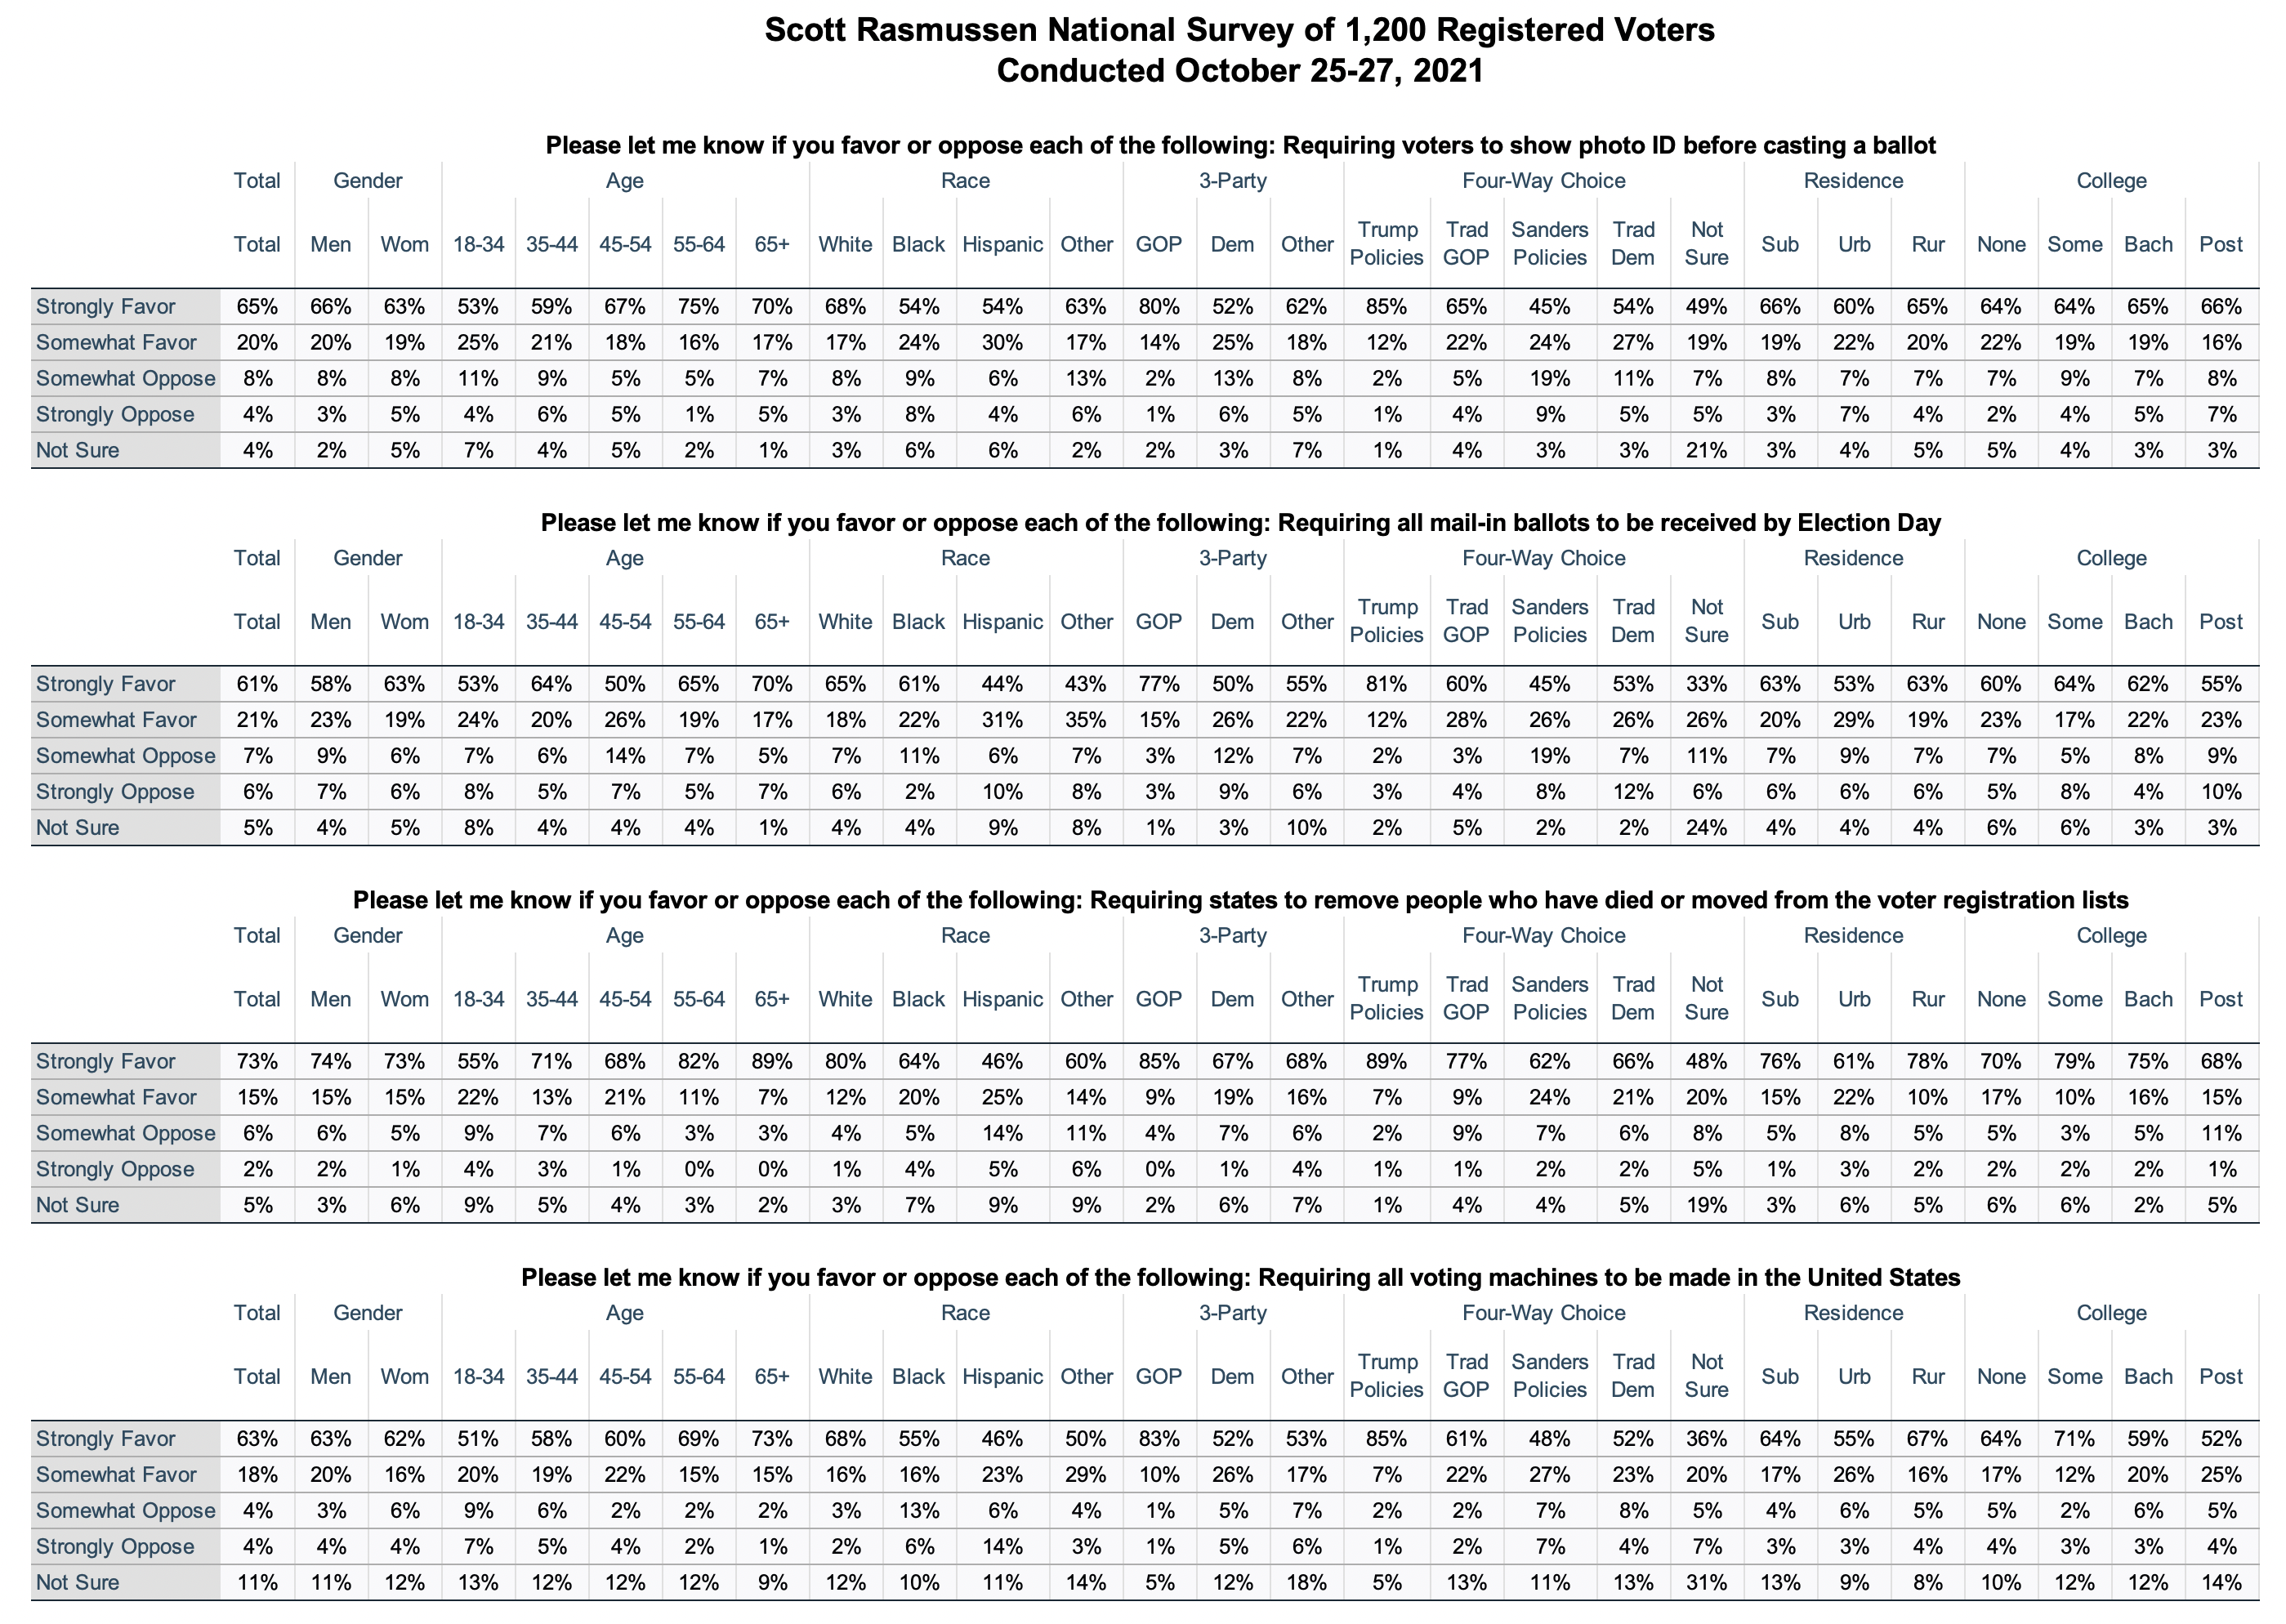
Eighty-one percent (81%) of voters want all voting machines made in the United States. A Scott Rasmussen national survey found that just 8% are opposed and 11% are not sure.
The survey also found that 88% want to see a requirement for states to remove people who have died or moved from voter registration lists; 85% want all voters to show photo ID before casting a ballot, and 82% want all ballots to be received by Election Day.
SIGN UP to receive Scott’s free email newsletter.
CHECK OUT Scott’s latest polls.
Note: Neither Scott Rasmussen, ScottRasmussen.com, nor RMG Research, Inc. have any affiliation with Rasmussen Reports. While Scott Rasmussen founded that firm, he left more than seven years ago and has had no involvement since that time.
Question 1:
Please let me know if you favor or oppose each of the following:
Requiring voters to show photo ID before casting a ballot
65% Strongly favor
20% Somewhat favor
8% Somewhat oppose
4% Strongly oppose
4% Not sure
Requiring all mail-in ballots to be received by Election Day
61% Strongly favor
21% Somewhat favor
7% Somewhat oppose
6% Strongly oppose
5% Not sure
Requiring states to remove people who have died or moved from the voter registration lists
73% Strongly favor
15% Somewhat favor
6% Somewhat oppose
2% Strongly oppose
5% Not sure
Requiring all voting machines to be made in the United States
63% Strongly favor
18% Somewhat favor
4% Somewhat oppose
4% Strongly oppose
11% Not sure
Methodology
The survey of 1,200 Registered Voters was conducted online by Scott Rasmussen on October 25-27, 2021. Field work for the survey was conducted by RMG Research, Inc. Certain quotas were applied, and the sample was lightly weighted by geography, gender, age, race, education, internet usage, and political party to reasonably reflect the nation’s population of Registered Voters. Other variables were reviewed to ensure that the final sample is representative of that population.