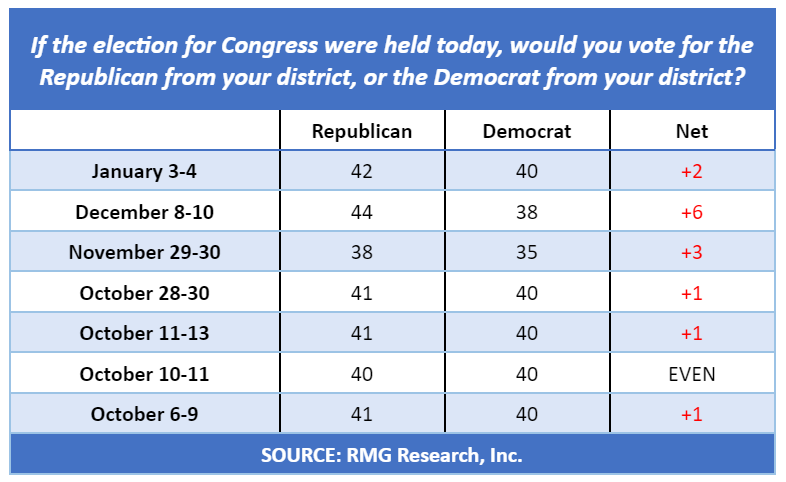
If the midterm elections were held today, 42% of Registered Voters would cast their ballot for a Republican while 40% would vote for a Democrat. The latest Scott Rasmussen national survey found that 8% would vote for some other candidate and 10% are not sure.
These results include “leaners.” They are people who initially express no preference for either party. However, on a follow-up question, they indicate a preference if they had to make a choice right now. Without leaners, the Republican advantage on this latest survey was two percentage points this month and three percentage points in December.
It is important to note that these totals are for Registered Voters and do not account for intensity of support or intention to vote. Generally speaking, Republicans and conservatives show more enthusiasm about the midterms than Democrats and progressives.
Last month, the GOP held a six point advantage on the Generic Ballot.
Looking back a bit further, Democrats never trailed on the Generic Ballot from the beginning of the year through September. Since October, however, it is the Republican Party that has never trailed.
Given a choice between four presidential candidates with equal skills and temperament. 32% would prefer a Republican who supported policies like President Trump; 23% would favor a traditional Democrat; 18% are looking for a Democrat who supported policies similar to Senator Bernie Sanders; and, 15% are ready to support a traditional Republican?
Other recent survey data showed that 84% of voters believe public schools should teach the truth about slavery. At the same time, 81% believe public schools should teach that America was founded on the ideals of freedom, equality, and self-governance.
Fifty-three percent (53%) of voters believe the loss of educational opportunities from shutting down schools is a bigger threat to children than the possibility of getting COVID. A Scott Rasmussen national survey found that 31% disagree and believe COVID is the bigger threat.
When fighting the COVID pandemic, 54% of voters believe the focus should be on balancing health care concerns with social, lifestyle, and economic concerns. Thirty-four percent (34%) disagree and believe it is more important to stop COVID at all costs. Republicans and Independents tend to believe a balanced approach is best. Democrats are evenly divided.
Seventy-one percent (71%) of voters believe parents should play a significant role in the curriculum development process. Twenty-three percent (23%) disagree and 7% are not sure.
Forty-nine percent (49%) believe that parents currently have too little control over the process while 11% believe they have too much control.
SIGN UP to receive Scott’s free email newsletter.
CHECK OUT Scott’s latest polls.
Note: Neither Scott Rasmussen, ScottRasmussen.com, nor RMG Research, Inc. have any affiliation with Rasmussen Reports. While Scott Rasmussen founded that firm, he left more than seven years ago and has had no involvement since that time.
Question 1:
If the election for Congress were held today, would you vote for the Republican from your district, or the Democrat from your district?
42% Republican
40% Democrat
8% Other
10% Not sure
Question 2:
Suppose you had a choice between four presidential candidates. All four had equal skills and temperament. Would you prefer a Republican who supported policies like President Trump, a more traditional Republican, a Democrat who supported policies similar to Senator Bernie Sanders, or a more traditional Democrat?
32% A Republican supporting Trump’s policies
15% A more traditional Republican
18% A Democrat supporting Sanders’ policies
23% A more traditional Democrat
12% Not sure
Methodology
The survey of 1,000 Registered Voters was conducted online by Scott Rasmussen on January 3-4, 2022. Field work for the survey was conducted by RMG Research, Inc. Certain quotas were applied, and the sample was lightly weighted by geography, gender, age, race, education, internet usage, and political party to reasonably reflect the nation’s population of Registered Voters. Other variables were reviewed to ensure that the final sample is representative of that population.
The margin of sampling error for the full sample is +/- 3.1 percentage points.


