0118 JA America’s Best Days

SIGN UP to receive Scott’s free email newsletter.

CHECK OUT Scott’s latest polls.

Note: Neither Scott Rasmussen, ScottRasmussen.com, nor RMG Research, Inc. have any affiliation with Rasmussen Reports. While Scott Rasmussen founded that firm, he left nearly a decade ago and has had no involvement since that time.

Question 1:

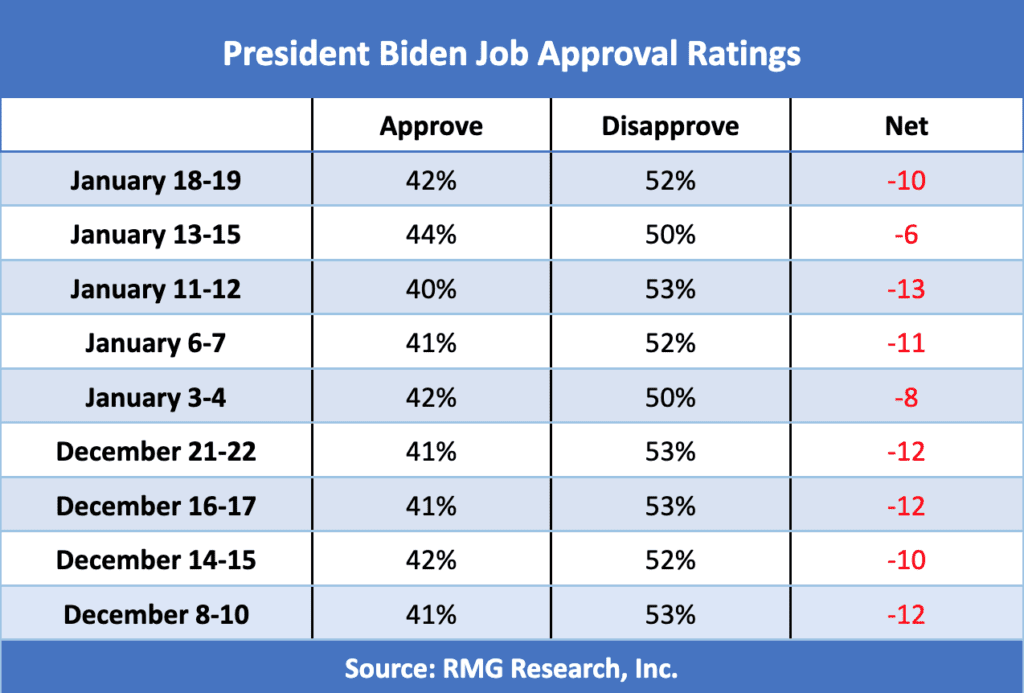
Do you approve or disapprove of the way President Biden is performing his job?

16%    Strongly approve

26%    Somewhat approve

14%    Somewhat disapprove

38%    Strongly disapprove

7%    Not sure

Question 2:

Suppose you had a choice between four presidential candidates. All four had equal skills and temperament. Would you prefer a Republican who supported policies like President Trump, a more traditional Republican, a Democrat who supported policies similar to Senator Bernie Sanders, or a more traditional Democrat?

30%    A Republican supporting Trump’s policies

17%    A more traditional Republican

21%    A Democrat supporting Sanders’ policies

19%    A more traditional Democrat

13%    Not sure

Question 3:

Are America’s best days still to come, or have they come and gone?

42%    Still to come

34%    Come and gone

24%    Not sure

Question 4:

Generally speaking, is American society today fair and decent, or is it unfair and discriminatory?

34%    Fair and decent

52%    Unfair and discriminatory

14%    Not sure

Methodology

The survey of 1,200 Registered Voters was conducted online by Scott Rasmussen on January 18-19, 2022. Field work for the survey was conducted by RMG Research, Inc. Certain quotas were applied, and the sample was lightly weighted by geography, gender, age, race, education, internet usage, and political party to reasonably reflect the nation’s population of Registered Voters. Other variables were reviewed to ensure that the final sample is representative of that population.

The margin of sampling error for the full sample is +/- 2.8 percentage points.

Posted in Uncategorized | Tagged , , , , , ,

Scott's Newsletter
Sign up for Scott's newsletter and get his political insight delivered right to your inbox!

Plurality of Voters Prefer Trump-like Policies

Given a choice between four presidential candidates with equal skills and temperament, 32% would prefer a candidate who supported policies like those of former President Trump. A Scott Rasmussen national survey found that 21% would like a candidate who supported policies like those of Senator Bernie Sanders; 21% favor a traditional Democrat; and, 15% favor a traditional Republican.

Voters under 45 are more likely to support Sanders-like policies. Older voters are more likely to support Trump-like policies.

Among urban voters, a plurality prefer Sanders-like policies. In the suburbs and rural areas, Trump-like policies are the most popular.

Among those with a college degree, a narrow plurality prefers policies like those of Senator Sanders. A solid plurality of those without a college degree prefer policies like those of President Trump.

It’s important to remember that the question focused on the policy preference assuming that the candidates had equal skills and temperament. As a result, it cannot be assumed that someone who supports policies like those of Trump or Sanders would automatically support Trump or Sanders as a candidate.

We have been asking this question regularly since last October. Despite the election results and everything that has happened since, these attitudes have remained remarkably stable. The current results are similar to those found in April.

  • These numbers show 47% favoring one of the Republican leaning options while 42% prefer a Democratic leaning set of policies. In every update of the survey, the partisan split has remained essentially even. That’s not surprising given that we have had nine consecutive presidential elections where neither candidate has received more than 53% of the vote. It’s the longest such stretch in American history.
  • On the Republican side, the number preferring Trump-like policies is consistently two to three times as large as the number favoring traditional GOP policies. However, younger GOP-leaning voters are more evenly divided.
  • On the other hand, the two wings of the Democratic party are always just about evenly divided.

SIGN UP to receive Scott’s free email newsletter.

CHECK OUT Scott’s latest polls.

Note: Neither Scott Rasmussen, ScottRasmussen.com, nor RMG Research, Inc. have any affiliation with Rasmussen Reports. While Scott Rasmussen founded that firm, he left more than seven years ago and has had no involvement since that time.

Methodology

The survey of 1,200 Registered Voters was conducted by Scott Rasmussen using a mixed mode approach from July 8-10, 2021. Field work for the survey was conducted by RMG Research, Inc. Most respondents were contacted online or via text while 231 were contacted using automated phone polling techniques. Online respondents were selected from a list of Registered Voters and through a process of Random Digital Engagement. Certain quotas were applied, and the sample was lightly weighted by geography, gender, age, race, education, internet usage, and political party to reasonably reflect the nation’s population of Registered Voters. Other variables were reviewed to ensure that the final sample is representative of that population.

Posted in Uncategorized | Tagged , , ,

Scott's Newsletter
Sign up for Scott's newsletter and get his political insight delivered right to your inbox!

31% Prefer a Candidate Pursuing Trump-like Policies

Given a choice between four presidential candidates with equal skills and temperament, 31% would prefer a candidate who supported policies like those of President Trump. A Scott Rasmussen national survey found that 24% would like a candidate who supported policies like those of Senator Bernie Sanders; 20% favor a traditional Democrat; and, 15% favor a traditional Republican.

We have been asking this question regularly since last October. Despite the election results and everything that has happened since, these attitudes have remained remarkably stable.

  • These numbers show 46% favoring one of the Republican leaning options while 44% prefer a Democratic leaning set of policies. In every update of the survey, the partisan split has remained essentially even. That’s not surprising given that we have had nine consecutive presidential elections where neither candidate has received more than 53% of the vote. It’s the longest such stretch in American history.
  • On the Republican side, the number preferring Trump-like policies is consistently two to three times as large as the number favoring traditional GOP policies. However, younger GOP-leaning voters are more evenly divided.
  • On the other hand, the two wings of the Democratic party are always just about evenly divided.
  • Urban voters strongly support one of the Democratic options. Those in the suburbs lean towards one of the GOP options while rural voters prefer the GOP.
  • Those favoring populist policies (Trump or Sanders) consistently outnumber those favoring more traditional policies. This week, the numbers show 55% favoring populist policies while 35% prefer a more traditional approach.

SIGN UP to receive Scott’s free email newsletter.

CHECK OUT Scott’s latest polls.

Note: Neither Scott Rasmussen, ScottRasmussen.com, nor RMG Research, Inc. have any affiliation with Rasmussen Reports. While Scott Rasmussen founded that firm, he left more than seven years ago and has had no involvement since that time.

Methodology

The survey of 1,200 Registered Voters was conducted by Scott Rasmussen using a mixed mode approach from April 15-17, 2021. Field work for the survey was conducted by RMG Research, Inc. Most respondents were contacted online or via text while 261 were contacted using automated phone polling techniques. Online respondents were selected from a list of Registered Voters and through a process of Random Digital Engagement. Certain quotas were applied, and the sample was lightly weighted by geography, gender, age, race, education, internet usage, and political party to reasonably reflect the nation’s population of Registered Voters. Other variables were reviewed to ensure that the final sample is representative of that population.

Posted in Uncategorized | Tagged , , ,

Scott's Newsletter
Sign up for Scott's newsletter and get his political insight delivered right to your inbox!

52% Favor Populist Policies, 37% Prefer Traditional Politics

Given a choice between four presidential candidates with equal skills and temperament, 52% of voters would favor a candidate promoting populist policies such as those advocated by Donald Trump or Bernie Sanders. A Scott Rasmussen national survey found that 37% would prefer more traditional establishment policies.

On a partisan basis, the results are nearly even: 45% want either Trump-like or traditional Republican policies while 44% prefer either Sanders-like or traditional Democratic policies. Overall, the results are very similar to the numbers found last October.

The totals include 30% who prefer policies like those of Trump and 15% who would rather see traditional Republican policies. On the other side of the aisle, 22% prefer policies like those offered by Sanders and 22% favor traditional Democratic policies.

Scott Rasmussen has been asking this question on a weekly basis. While the numbers periodically fluctuate, the dynamics are always the same. The partisan preference is split down the middle.

Within the parties, though, things appear to be much different. On the Republican side, the Trump like policies dominate. Typically, those supporting such policies outnumber those who would like more traditional policies by a 2 or 3 to 1 margin. On the Democratic side, the establishment and populist forces are virtually equal in number.

These results suggest potential for a significant shift in the partisan alignment over the coming years. What that alignment might be is unclear. For example, it’s easy to envision those who favor traditional Republican or traditional Democratic policies finding common ground. However, such an alliance in one party might push populists into the other party.

For now, these results provide a useful way to analyze the electorate.

SIGN UP to receive Scott’s free email newsletter.

CHECK OUT Scott’s latest polls.

Note: Neither Scott Rasmussen, ScottRasmussen.com, nor RMG Research, Inc. have any affiliation with Rasmussen Reports. While Scott Rasmussen founded that firm, he left more than seven years ago and has had no involvement since that time.

Methodology

The survey of 1,200 Registered Voters was conducted by Scott Rasmussen using a mixed mode approach from March 18-20, 2021. Field work for the survey was conducted by RMG Research, Inc. Most respondents were contacted online or via text while 201 were contacted using automated phone polling techniques. Online respondents were selected from a list of Registered Voters and through a process of Random Digital Engagement. Certain quotas were applied, and the sample was lightly weighted by geography, gender, age, race, education, and political party to reasonably reflect the nation’s population of Registered Voters. Other variables were reviewed to ensure that the final sample is representative of that population.


Posted in Poll Results | Tagged , ,

Scott's Newsletter
Sign up for Scott's newsletter and get his political insight delivered right to your inbox!