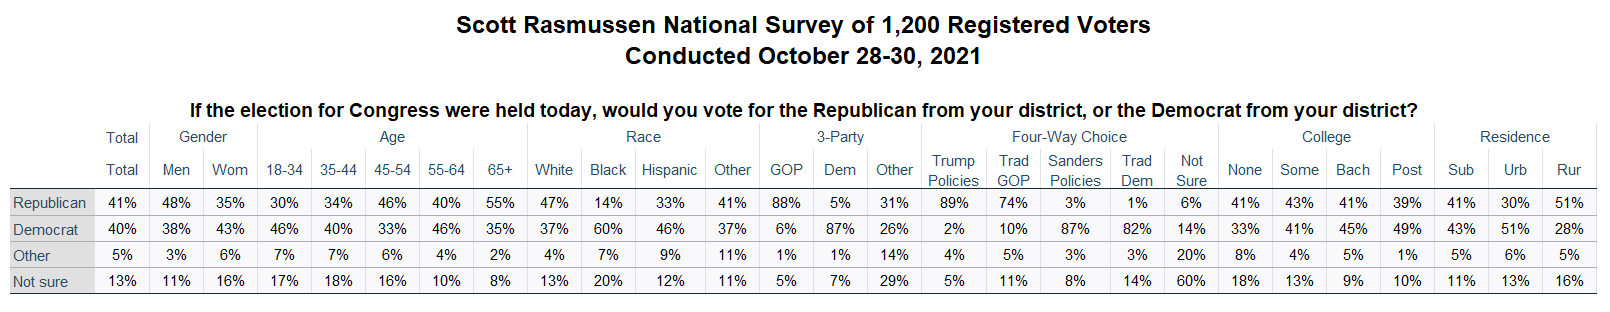
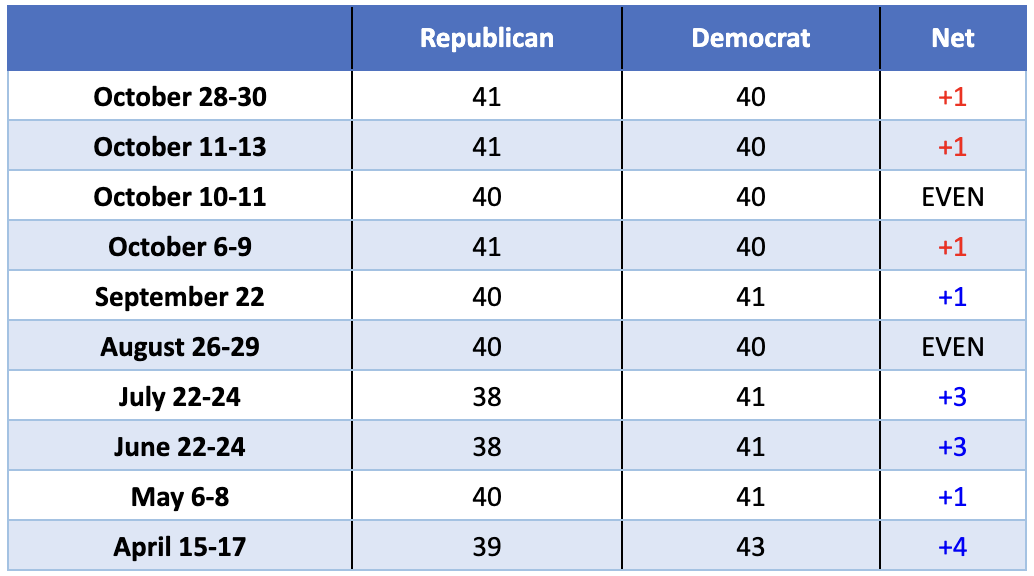
If the midterm elections were held today, 41% of Registered Voters would vote for the Republican from their Congressional District while 40% would vote for the Democrat. Those numbers are unchanged since mid-October. A Scott Rasmussen national survey found that 5% would vote for some other candidate while 13% are not sure.
The survey was conducted just prior to last week’s elections in Virginia. The survey is of Registered Voters rather than Likely Voters. In last week’s elections, conservative and Republican voters were more likely than others to cast a ballot. If that enthusiasm advantage continues into the midterm elections, the numbers suggest the GOP would win a sizable victory in 2022.
A Scott Rasmussen Election Night survey in Virginia showed that 81% of Virginia voters believe photo IDs should be required for voting; 71% of Youngkin voters believe you can support Trump policies without supporting Trump while 61% of McAuliffe voters disagree; and, 83% of Virginia voters agree that “America was founded on the ideals of freedom, equality, and self-governance.”
National voter surveys found that four key election reforms are supported by more than 80% of voters. These include requirements to remove people who have died or moved from voter registration lists; requiring all voters to show photo ID before casting a ballot; wanting all ballots received by Election Day; and, having all voting machines made in the United States.
On another topic, 40% of voters believe the worst of the pandemic is behind us while 30% believe the worst is yet to come. Optimism on this front has been growing over the past month.
Seventy-five percent (75%) of voters are close to resuming their normal life in terms of going out socially, traveling, and interacting with others in person. The hesitance of those who have been vaccinated to resume normal activities may be one factor driving economic challenges.
Currently 45% of voters believe the U.S. is in a recession. Large majorities have experienced sharp inflation and supply chain issues.
SIGN UP to receive Scott’s free email newsletter.
CHECK OUT Scott’s latest polls.
Note: Neither Scott Rasmussen, ScottRasmussen.com, nor RMG Research, Inc. have any affiliation with Rasmussen Reports. While Scott Rasmussen founded that firm, he left more than seven years ago and has had no involvement since that time.
Question:
If elections for Congress were held today, would you vote for the Republican from your district, or the Democrat from your district?
41% Republican
40% Democrat
5% Other
13% Not sure
Methodology
The survey of 1,200 Registered Voters was conducted online by Scott Rasmussen on October 28-30, 2021. Field work for the survey was conducted by RMG Research, Inc. Certain quotas were applied, and the sample was lightly weighted by geography, gender, age, race, education, internet usage, and political party to reasonably reflect the nation’s population of Registered Voters. Other variables were reviewed to ensure that the final sample is representative of that population.