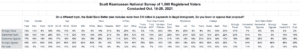
The Build Back Better plan includes more than $10 billion in payments to illegal immigrants. Twenty-eight percent (28%) of voters favor that provision while 60% are opposed.
Those totals include 12% who Strongly Favor the payments while 43% are Strongly Opposed.
The strongest backers of the president’s plan support the payments to illegal immigrants by a 3-to-1 margin. However, among the less committed voters who Somewhat Favor the president’s plan, a majority (52%) are opposed to this provision.
Not surprisingly, those who oppose the Build Back Better plan also strongly oppose the payments to illegal immigrants. Additionally, among those who have never heard of the president’s plan, 70% oppose the payments to illegal immigrants.
Overall, 83% of Republicans oppose the payments while 53% of Democrats favor them. Among Independent voters, 19% support this provision and 70% are opposed.
The payments are supported by 52% of Urban voters, 25% of Suburban voters, and 21% of Rural voters.
Fifty-two percent (52%) of Hispanic voters favor this provision of the Build Back Better plan. So do 46% of Black voters. However, 68% of White voters are opposed.
Just 38% of voters approve of the way President Biden is handling the issues of government spending and taxes. Fifty-one percent (51%) disapprove.
His plan–called the Big Government Socialism bill by Republicans–includes some popular provisions but many other that are problematic for voters.
- The plan calls for vastly expanding the level of personal banking information reported to the IRS. However, 72% of voters think the IRS already collects too much personal information that should remain private. Rather than giving the IRS more access, these voters believe that more privacy protections are needed.
- To receive federal benefits, 78% think those who are able should be required to work. The president’s plan opposes such work requirements.
- Another provision would provide tax credits of up to $50,000 for print journalists. Just 19% of voters favor that provision.
SIGN UP to receive Scott’s free email newsletter.
CHECK OUT Scott’s latest polls.
Note: Neither Scott Rasmussen, ScottRasmussen.com, nor RMG Research, Inc. have any affiliation with Rasmussen Reports. While Scott Rasmussen founded that firm, he left more than seven years ago and has had no involvement since that time.
Methodology
The survey of 1,000 Registered Voters was conducted online by Scott Rasmussen on October 18-20, 2021. Field work for the survey was conducted by RMG Research, Inc. Certain quotas were applied, and the sample was lightly weighted by geography, gender, age, race, education, internet usage, and political party to reasonably reflect the nation’s population of Registered Voters. Other variables were reviewed to ensure that the final sample is representative of that population.
The margin of sampling error for the full sample is +/- 3.1percentage points.