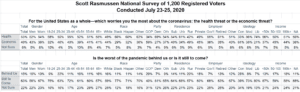
When asked about what worries them most about the coronavirus threat to our nation, 53% now express concern about the health threat while 40% are more worried about the threat to the U.S. economy.
These numbers reflect a significant change from mid-June when a Ballotpedia national survey found more concern about the economy.
Broadly speaking, optimism about recovering from the pandemic grew steadily from late March until mid-June. Since then, they have moved in the opposite direction.
- In late March, just 38% were more worried about the economic threat while 53% expressed greater concern about the health threat.
- By mid-June, however,three straight weeks of polling found more concern about the economic threat rather than the health threat.
- Now, the numbers have returned to the levels first recorded in late March. Whatever bounce in optimism took place, it is gone.
Most Republicans (59%) are still more concerned about the economic threat. Most Democrats (69%) and Independents (54%) are primarily concerned with the health threat.
Other data from the survey shows that just 15% of voters believe the worst of the pandemic is behind us. Sixty-three percent (63%) believe the worst is still to come. That also reflects growing pessimism since mid-June. The highest level of optimism measured found that 29% of voters believed that the worst was behind us while 42% thought the worst was still to come.
LISTEN TO Scott’s Podcast.
SIGN UP to receive Scott’s free email newsletter.
CHECK OUT Scott’s latest polls.
Neither Scott Rasmussen, ScottRasmussen.com, nor RMG Research, Inc. have any connection or relationship with Rasmussen Reports. Scott Rasmussen left that firm more than seven years ago and has had no involvement with it since then.
Methodology
The survey of 1,200 Registered Voters was conducted by Scott Rasmussen using a mixed mode approach from July 23-25, 2020. Field work for the survey was conducted by RMG Research, Inc. Most respondents were contacted online or via text while 161 were contacted using automated phone polling techniques. Certain quotas were applied to the overall sample and lightly weighted by geography, gender, age, race, education, and political party to reasonably reflect the nation’s population of Registered Voters. Other variables were reviewed to ensure that the final sample is representative of that population.