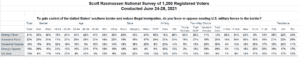
To gain control of the United States’ southern border and reduce illegal immigration, 53% of voters favor sending U.S. military forces to the border. A Scott Rasmussen national survey found that 34% oppose that action and 13% are not sure.
The totals include 31% who Strongly Favor sending the military and 18% who are Strongly Opposed.
Data released earlier shows that 70% of voters believe immigration and border control to be a national security issue. Additionally, 60% see the growing number of illegal immigrants to be an invasion of the United States. Not only that, 58% believe drug cartels have more control of the border than the U.S. government.
SIGN UP to receive Scott’s free email newsletter.
Fifty-nine percent (59%) of rural voters support sending troops to the border. So do 56% of suburban voters and 44% of urban voters.
Seventy-four percent (74%) of Republican voters favor sending the military while 53% of Democrats are opposed. Among Independents, 49% favor the idea and 27% are opposed.
Among those who prefer Trump-like policies, 82% support sending the military to the border. Just 53% of those who favor traditional Republican policies agree.
Overall, 50% of voters believe illegal immigration to be a crisis. President Biden has so far received relatively low marks for his handling of the situation at the border.
SIGN UP to receive Scott’s free email newsletter.
CHECK OUT Scott’s latest polls.
Note: Neither Scott Rasmussen, ScottRasmussen.com, nor RMG Research, Inc. have any affiliation with Rasmussen Reports. While Scott Rasmussen founded that firm, he left more than seven years ago and has had no involvement since that time.
Methodology
The survey of 1,200 Registered Voters was conducted by Scott Rasmussen using a mixed mode approach from June 24-26, 2021. Field work for the survey was conducted by RMG Research, Inc. Most respondents were contacted online or via text while 153 were contacted using automated phone polling techniques. Online respondents were selected from a list of Registered Voters and through a process of Random Digital Engagement. Certain quotas were applied, and the sample was lightly weighted by geography, gender, age, race, education, internet usage, and political party to reasonably reflect the nation’s population of Registered Voters. Other variables were reviewed to ensure that the final sample is representative of that population.