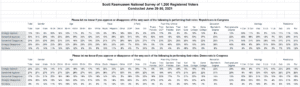
Forty-seven percent (47%) of voters nationwide approve of the way Democrats in Congress have performed their role. A Scott Rasmussen national survey found that 41% approve of the performance of Republicans in Congress.
Those totals include 20% who Strongly Approve of the Democrats and 11% who Strongly Approve of the Republicans.
Among those who support Trump-like policies, 72% approve of the Republicans in Congress. As for those who support traditional Republican policies, 61% provide such a positive review.
Among those who support Sanders-like policies, 75% approve of the Democrats in Congress. Among those who prefer traditional Democratic policies, 86% offer their approval.
It is interesting to note that traditional Republicans are somewhat less pleased with Republicans in Congress than the more populist voters who prefer Trump-like policies. The reverse dynamic is found among Democrats–their populist voters offer somewhat less approval.
In tracking going back to last October, the number preferring Trump-like policies is consistently two to three times as large as the number favoring traditional GOP. On the other hand, the two wings of the Democratic party are always just about evenly divided.
Among Independent voters, 31% have no opinion of either the Republicans or Democrats in Congress. Twenty-seven percent (27%) approve of the Democrats and 21% say the same about Republicans.
Voters with a college degree are more likely to approve of Democrats rather than Republicans in Congress. The opposite is true for those without a college degree.
SIGN UP to receive Scott’s free email newsletter.
CHECK OUT Scott’s latest polls.
Note: Neither Scott Rasmussen, ScottRasmussen.com, nor RMG Research, Inc. have any affiliation with Rasmussen Reports. While Scott Rasmussen founded that firm, he left more than seven years ago and has had no involvement since that time.
Methodology
The online survey of 1,000 Registered Voters was conducted by Scott Rasmussen on June 29-30, 2021. Field work for the survey was conducted by RMG Research, Inc. Certain quotas were applied, and the sample was lightly weighted by geography, gender, age, race, education, internet usage, and political party to reasonably reflect the nation’s population of Registered Voters. Other variables were reviewed to ensure that the final sample is representative of that population.