Forty percent (40%) of voters nationwide believe American society is generally fair and decent. A Scott Rasmussen national survey found that 50% disagree and believe American society is generally unfair and discriminatory.
Those figures are little changed since last June. Following the killing of George Floyd, just 38% believed our society is generally fair and decent while 47% took the opposite view.
However, these numbers reflect a dramatic change from the first time Scott Rasmussen asked that question back in the 1990s. In those days, voters routinely said society was generally fair and decent by roughly a 2-to-1 margin.
Fifty-seven percent (57%) of Republicans believe American society is generally fair and decent. However, 61% of of Democrats take the opposite view. So do 52% of Independent voters.
Not surprisingly, there is also a big racial divide on this question. White voters are evenly divided while 64% of Black voters say our society is unfair and discriminatory. Fifty-nine percent (59%) of Hispanic voters agree.
Other data from the survey found that 76% of voters believe most Americans want to live in a society where white and Black Americans are treated equally. Thirteen percent (13%) believe that’s not true and 11% aren’t sure.
SIGN UP to receive Scott’s free email newsletter.
CHECK OUT Scott’s latest polls.
Note: Neither Scott Rasmussen, ScottRasmussen.com, nor RMG Research, Inc. have any affiliation with Rasmussen Reports. While Scott Rasmussen founded that firm, he left more than seven years ago and has had no involvement since that time.
Methodology
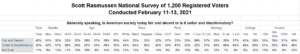
The survey of 1,200 Registered Voters was conducted by Scott Rasmussen using a mixed mode approach from February 11-13, 2021. Field work for the survey was conducted by RMG Research, Inc. Most respondents were contacted online or via text while 112 were contacted using automated phone polling techniques. Online respondents were selected from a list of Registered Voters and through a process of Random Digital Engagement. Certain quotas were applied, and the sample was lightly weighted by geography, gender, age, race, education, and political party to reasonably reflect the nation’s population of Registered Voters. Other variables were reviewed to ensure that the final sample is representative of that population.