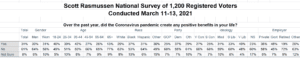
Thirty-one percent (31%) of voters say that the Coronavirus pandemic created some positive benefits in their life. A Scott Rasmussen national survey found that 61% can’t think of any positive benefits while 8% are not sure.
Most private sector workers (58%) and retirees (72%) couldn’t think of any positive benefits in their life. However, among government employees 48% remembered some positive benefits while 45% could not.
The broad category of government employees covers many types of jobs, everything from career bureaucrats to first responders and teachers. Within this group, there is a significant difference of opinion. Those who work at a school or college are far more likely than other government employees to report positive benefits from the pandemic.
By a 60% to 36% margin, those who work in education report positive benefits. Among all other government employees, the results are similar to the population at large: 35% remember positive benefits while 53% do not.
Data released last week showed that 42% of all voters believe the worst of the pandemic is behind us while 27% think the worst is still to come. That’s the most optimistic assessment to date.
Looking back, 50% of voters believe many states and cities overreacted to the coronavirus pandemic in ways that did more harm than good. A Scott Rasmussen national survey found that 37% disagree and 13% are not sure.
SIGN UP to receive Scott’s free email newsletter.
CHECK OUT Scott’s latest polls.
Note: Neither Scott Rasmussen, ScottRasmussen.com, nor RMG Research, Inc. have any affiliation with Rasmussen Reports. While Scott Rasmussen founded that firm, he left more than seven years ago and has had no involvement since that time.
Methodology
The survey of 1,200 Registered Voters was conducted by Scott Rasmussen using a mixed mode approach from March 11-13, 2021. Field work for the survey was conducted by RMG Research, Inc. Most respondents were contacted online or via text while 194 were contacted using automated phone polling techniques. Online respondents were selected from a list of Registered Voters and through a process of Random Digital Engagement. Certain quotas were applied, and the sample was lightly weighted by geography, gender, age, race, education, and political party to reasonably reflect the nation’s population of Registered Voters. Other variables were reviewed to ensure that the final sample is representative of that population.