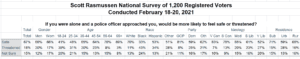
If they were alone and approached by a police officer, 43% of African-American voters say they would feel threatened rather than safe. A Scott Rasmussen national survey found that 33% of African-Americans would feel safe and 24% are not sure.
These results are especially striking because a majority or plurality of every other measured demographic group would feel safe in that situation. Seventy-six percent (76%) of White voters would feel safe along with 53% of Hispanic voters.
Overall, among all voters, 67% would feel safe and 18% would feel threatened.
There was no gender gap, but a significant generation gap. Among senior citizens, 89% would feel safe and 3% would be threatened. Voters 18-24 were more evenly divided: 41% would feel safe, 39% threatened.
On a partisan basis, 81% of Republicans say they would feel safe in that situation. So would 59% of Democrats and 62% of Independents.
As on many issues, there is a significant gap between the views of White and Black Democrats. Seventy-two percent (72%) of White Democrats would feel safe while only 14% would be threatened. However, a plurality of Black Democrats (44%) would feel threatened. Just 37% would feel safe.
SIGN UP to receive Scott’s free email newsletter.
CHECK OUT Scott’s latest polls.
Note: Neither Scott Rasmussen, ScottRasmussen.com, nor RMG Research, Inc. have any affiliation with Rasmussen Reports. While Scott Rasmussen founded that firm, he left more than seven years ago and has had no involvement since that time.
Methodology
The survey of 1,200 Registered Voters was conducted by Scott Rasmussen using a mixed mode approach from February 18-20, 2021. Field work for the survey was conducted by RMG Research, Inc. Most respondents were contacted online or via text while 212 were contacted using automated phone polling techniques. Online respondents were selected from a list of Registered Voters and through a process of Random Digital Engagement. Certain quotas were applied, and the sample was lightly weighted by geography, gender, age, race, education, and political party to reasonably reflect the nation’s population of Registered Voters. Other variables were reviewed to ensure that the final sample is representative of that population.