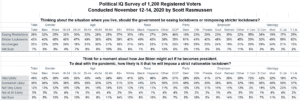
To deal with the pandemic, 75% of voters believe President-elect Biden will impose a strict nationwide lockdown. A Political IQ poll found that 15% consider such a lockdown order unlikely while 9% are not sure.
Those totals include 40% who consider it Very Likely and just 3% who say it’s Not at All Likely.
At the same time, however, just 43% believe governments should be imposing stricter lockdowns where they live. The poll, conducted by Scott Rasmussen, found that 50% believe governments should either be easing restrictions (28%) or making no changes (22%). An additional 7% are not sure.
There is a broad expectation across all segments of society that Biden is likely to impose a strict national lockdown. However, there is a huge partisan divide as to whether that’s the right thing to do.
- Eighty-one percent (81%) of Republicans expect Biden will try to impose a strict national lockdown. Just 25% of GOP voters favor stricter lockdowns in their own area.
- Seventy-six percent (76%) of Democrats think it’s likely Biden will impose a strict national lockdown. Sixty-one percent (61%) of Democrats want stricter lockdowns in their area.
- Among Independent voters, 69% believe Biden will impose a national lockdown while 41% think that’s the appropriate policy.
LISTEN TO Scott’s Podcast.
SIGN UP to receive Scott’s free email newsletter.
CHECK OUT Scott’s latest polls.
Note: Neither Scott Rasmussen, ScottRasmussen.com, nor RMG Research, Inc. have any affiliation with Rasmussen Reports. While Scott Rasmussen founded that firm, he left more than seven years ago and has had no involvement since that time.
Methodology
The survey of 1,200 Registered Voters was conducted by Scott Rasmussen using a mixed mode approach from November 12-14, 2020. Field work for the survey was conducted by RMG Research, Inc. Most respondents were contacted online or via text while 276 were contacted using automated phone polling techniques. Online respondents were selected from a list of Registered Voters and through a process of Random Digital Engagement. Certain quotas were applied to the larger sample and lightly weighted by geography, gender, age, race, education, and political party to reasonably reflect the nation’s population of Registered Voters. Other variables were reviewed to ensure that the final sample is representative of that population.