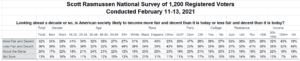
Thirty-two percent (32%) of voters believe that, over the next decade or so, American society will become more fair and decent. A Scott Rasmussen national survey found that 36% hold the opposite view and believe society will become less fair and decent. Twenty percent (20%) expect things to remain about the same and 13% are not sure.
Mixed views are found in all measured demographic groups. However, a plurality of Democrats, college graduates, urban voters, and upper income voters express an optimistic view. Republicans, white voters, rural voters, and lower-income voters have a more pessimistic assessment. This may simply reflect the fact that supporters of the team in the White House are typically more optimistic than supporters of the team that is out of power.
Data released earlier showed that 40% believe American society is generally fair and decent. Fifty percent (45%) hold the opposite view. These figures are little changed from last June, but are notably more pessimistic than in the 1990s.
Just 14% of voters think society is currently fair and decent and will get even better over the next decade.
At the other end of the spectrum, 17% believe society is currently unfair and discriminatory and will get worse.
SIGN UP to receive Scott’s free email newsletter.
CHECK OUT Scott’s latest polls.
Note: Neither Scott Rasmussen, ScottRasmussen.com, nor RMG Research, Inc. have any affiliation with Rasmussen Reports. While Scott Rasmussen founded that firm, he left more than seven years ago and has had no involvement since that time.
Methodology
The survey of 1,200 Registered Voters was conducted by Scott Rasmussen using a mixed mode approach from February 11-13, 2021. Field work for the survey was conducted by RMG Research, Inc. Most respondents were contacted online or via text while 112 were contacted using automated phone polling techniques. Online respondents were selected from a list of Registered Voters and through a process of Random Digital Engagement. Certain quotas were applied, and the sample was lightly weighted by geography, gender, age, race, education, and political party to reasonably reflect the nation’s population of Registered Voters. Other variables were reviewed to ensure that the final sample is representative of that population.