Sixty-seven percent (67%) of voters believe the decline of the family is harming American growth and prosperity. A Scott Rasmussen national survey found that 23% disagree and 10% are not sure.
Those totals include 33% who Strongly Agree and 10% who Strongly Disagree.
Seventy-six percent (76%) of Republicans believe the decline of the family is harming American growth and prosperity. So do 63% of Democrats and 63% of Independent voters
That view is shared by 78% of Senior Citizens and 55% of voters under 35.
Note: Neither Scott Rasmussen, ScottRasmussen.com, nor RMG Research, Inc. have any affiliation with Rasmussen Reports. While Scott Rasmussen founded that firm, he left nearly a decade ago and has had no involvement since that time.
Methodology
The survey of 1,200 Registered Voters was conducted online by Scott Rasmussen from January 20-21, 2022. Field work for the survey was conducted by RMG Research, Inc. Respondents were selected from a list of Registered Voters and through a process of Random Digital Engagement. Certain quotas were applied, and the sample was lightly weighted by geography, gender, age, race, education, internet usage, and political party to reasonably reflect the nation’s population of Registered Voters. Other variables were reviewed to ensure that the final sample is representative of that population.
Sixty-five percent (65%) of voters believe children who grow up without their father at home are at a significant disadvantage in life. A Scott Rasmussen national survey found that 30% disagree and 5% are not sure.
Those totals include 28% who Strongly Agree that growing up without a father at home is a disadvantage and 12% who Strongly Disagree.
Seventy-four percent (74%) of Republicans believe those without a father at home are disadvantaged. So do 60% of Democrats and 58% of Independents.
The survey also found 49% believe it is the responsibility of the community to step up and help support a fatherless child. Forty-three percent (43%) disagree.
Forty-two percent (42%) believe it is the responsibility of government to step up and help support such children. Forty-nine percent (49%) disagree.
Note: Neither Scott Rasmussen, ScottRasmussen.com, nor RMG Research, Inc. have any affiliation with Rasmussen Reports. While Scott Rasmussen founded that firm, he left nearly a decade ago and has had no involvement since that time.
Methodology
The survey of 1,200 Registered Voters was conducted online by Scott Rasmussen from January 20-21, 2022. Field work for the survey was conducted by RMG Research, Inc. Respondents were selected from a list of Registered Voters and through a process of Random Digital Engagement. Certain quotas were applied, and the sample was lightly weighted by geography, gender, age, race, education, internet usage, and political party to reasonably reflect the nation’s population of Registered Voters. Other variables were reviewed to ensure that the final sample is representative of that population.
To create a healthy society, 87% of voters believe it is important to have strong family ties with both parents involved in raising their children. A Scott Rasmussen national survey found that 8% disagree and 5% are not sure.
Those totals include 68% who say it is Very Important and 3% who say it is Not at All Important.
When it comes to raising children and teaching core values, 84% believe parents should bear primary responsibility. Eleven percent (11%) believe it should be the community at large and 5% are not sure.
Note: Neither Scott Rasmussen, ScottRasmussen.com, nor RMG Research, Inc. have any affiliation with Rasmussen Reports. While Scott Rasmussen founded that firm, he left nearly a decade ago and has had no involvement since that time.
Methodology
The survey of 1,200 Registered Voters was conducted online by Scott Rasmussen from January 20-21, 2022. Field work for the survey was conducted by RMG Research, Inc. Respondents were selected from a list of Registered Voters and through a process of Random Digital Engagement. Certain quotas were applied, and the sample was lightly weighted by geography, gender, age, race, education, internet usage, and political party to reasonably reflect the nation’s population of Registered Voters. Other variables were reviewed to ensure that the final sample is representative of that population.
Eighty-three percent (83%) of voters recognize that, when Germany was run by Adolf Hitler, their government systematically and intentionally killed approximately 6 million Jewish men, women, and children. A Scott Rasmussen national survey found that 7% do not believe it happened. Eleven percent (11%) are not sure.
Among voters over 65, just 3% deny the reality of the Holocaust. However, among those under 35, 12% do not believe it happened.
The survey also found that 53% believe anti-Semitism is a serious problem in America today. Thirty-three percent (33%) do not see it as a serious problem.
Note: Neither Scott Rasmussen, ScottRasmussen.com, nor RMG Research, Inc. have any affiliation with Rasmussen Reports. While Scott Rasmussen founded that firm, he left nearly a decade ago and has had no involvement since that time.
Methodology
The survey of 1,200 Registered Voters was conducted online by Scott Rasmussen from January 20-21, 2022. Field work for the survey was conducted by RMG Research, Inc. Respondents were selected from a list of Registered Voters and through a process of Random Digital Engagement. Certain quotas were applied, and the sample was lightly weighted by geography, gender, age, race, education, internet usage, and political party to reasonably reflect the nation’s population of Registered Voters. Other variables were reviewed to ensure that the final sample is representative of that population.
Thirty-six percent (36%) of voters believe the benefits of government are worth the costs. A Scott Rasmussen national survey found that 40% disagree and 24% are not sure.
Six months ago, by a 41% to 33% margin, a plurality said the benefits were worth the cost.
It is interesting to note that the decline occurred primarily among those who prefer traditional Republican policies. In both surveys, Democrats tended to believe the benefits were worth the cost. Also in both surveys, those who prefer Trump-like policies strongly believed the cost was too high.
However, six months ago, traditional Republicans thought the benefits were worth it by a 41% to 32% margin. Now, traditional Republicans take the opposite view by a 48% to 24% margin.
Note: Neither Scott Rasmussen, ScottRasmussen.com, nor RMG Research, Inc. have any affiliation with Rasmussen Reports. While Scott Rasmussen founded that firm, he left nearly a decade ago and has had no involvement since that time.
Methodology
The survey of 1,200 Registered Voters was conducted online by Scott Rasmussen from January 20-21, 2022. Field work for the survey was conducted by RMG Research, Inc. Respondents were selected from a list of Registered Voters and through a process of Random Digital Engagement. Certain quotas were applied, and the sample was lightly weighted by geography, gender, age, race, education, internet usage, and political party to reasonably reflect the nation’s population of Registered Voters. Other variables were reviewed to ensure that the final sample is representative of that population.
Note: Neither Scott Rasmussen, ScottRasmussen.com, nor RMG Research, Inc. have any affiliation with Rasmussen Reports. While Scott Rasmussen founded that firm, he left nearly a decade ago and has had no involvement since that time.
Question 1:
Do you approve or disapprove of the way President Biden is performing his job?
16% Strongly approve
26% Somewhat approve
14% Somewhat disapprove
38% Strongly disapprove
7% Not sure
Question 2:
Suppose you had a choice between four presidential candidates. All four had equal skills and temperament. Would you prefer a Republican who supported policies like President Trump, a more traditional Republican, a Democrat who supported policies similar to Senator Bernie Sanders, or a more traditional Democrat?
30% A Republican supporting Trump’s policies
17% A more traditional Republican
21% A Democrat supporting Sanders’ policies
19% A more traditional Democrat
13% Not sure
Question 3:
Are America’s best days still to come, or have they come and gone?
42% Still to come
34% Come and gone
24% Not sure
Question 4:
Generally speaking, is American society today fair and decent, or is it unfair and discriminatory?
34% Fair and decent
52% Unfair and discriminatory
14% Not sure
Methodology
The survey of 1,200 Registered Voters was conducted online by Scott Rasmussen on January 18-19, 2022. Field work for the survey was conducted by RMG Research, Inc. Certain quotas were applied, and the sample was lightly weighted by geography, gender, age, race, education, internet usage, and political party to reasonably reflect the nation’s population of Registered Voters. Other variables were reviewed to ensure that the final sample is representative of that population.
The margin of sampling error for the full sample is +/- 2.8 percentage points.
Forty-two percent (42%) of voters believe that America’s best days are still to come. A Scott Rasmussen national survey found that 34% disagree and believe America’s best days have come and gone. Twenty-four percent (24%) are not sure.
This assessment is far more pessimistic than the perceptions in November 2020. On the eve of the last presidential election, 61% believe the nation’s best days were still to come while just 20% thought they had come and gone.
Fifty-four percent (54%) of Democrats believe the best is yet to come. That view is shared by 38% of Republicans and 31% of Independents.
Data released earlier showed that 65% of voters believe the United States is more divided and polarized today than at any previous time in history.
Note: Neither Scott Rasmussen, ScottRasmussen.com, nor RMG Research, Inc. have any affiliation with Rasmussen Reports. While Scott Rasmussen founded that firm, he left nearly a decade ago and has had no involvement since that time.
Methodology
The survey of 1,200 Registered Voters was conducted online by Scott Rasmussen on January 18-19, 2022. Field work for the survey was conducted by RMG Research, Inc. Certain quotas were applied, and the sample was lightly weighted by geography, gender, age, race, education, internet usage, and political party to reasonably reflect the nation’s population of Registered Voters. Other variables were reviewed to ensure that the final sample is representative of that population.
The margin of sampling error for the full sample is +/- 2.8 percentage points.
If all NATO countries send troops to protect Ukraine, 55% of voters believe the United States should also send troops. A Scott Rasmussen national survey found that just 21% disagree and 24% are not sure.
However, just 33% believe the United States should go it alone while 32% are opposed.
The survey, conducted just before President Biden’s press conference, found that 65% believed it likely that Russia would invade Ukraine.
After being informed that Russia has warned against a future expansion of NATO, 46% believe NATO should invite Ukraine to join the alliance. Fifteen percent (15%) are opposed and 39% are not sure.
In considering these numbers, it is important to recognize how little voters have been focusing on this issue. Only 14% of voters are following news stories on the topic Very Closely. Another 37% say they are following it Somewhat Closely.
More broadly, 81% of voters believe it is important for the United States to play a leading role in global affairs and international policy.
Rather than trying to maintain our status as the world’s leading superpower, 27% think the United States should share global leadership with China and Russia.
Overall, 42% of voters have confidence in President Biden as Commander in Chief. Fifty-four percent (54%) do not. These figures generally reflect the president’s job approval ratings.
Note: Neither Scott Rasmussen, ScottRasmussen.com, nor RMG Research, Inc. have any affiliation with Rasmussen Reports. While Scott Rasmussen founded that firm, he left nearly a decade ago and has had no involvement since that time.
Methodology
The survey of 1,200 Registered Voters was conducted online by Scott Rasmussen on January 18-19, 2022. Field work for the survey was conducted by RMG Research, Inc. Certain quotas were applied, and the sample was lightly weighted by geography, gender, age, race, education, internet usage, and political party to reasonably reflect the nation’s population of Registered Voters. Other variables were reviewed to ensure that the final sample is representative of that population.
The margin of sampling error for the full sample is +/- 2.8 percentage points.
Fifty-three percent (53%) of voters are confident that American elections are conducted in a manner that ensures all votes are counted and that the proper winners are declared in each election. A Scott Rasmussen national survey found that 40% lack such confidence and 7% are not sure.
Eighty-five percent (85%) of Democrats currently express confidence in our system of elections. That confidence is shared by 48% of Independent voters and 33% of Republicans. Polling conducted over the past several decades has consistently shown that voters have more confidence in election results when their team wins the White House.
Despite the tepid confidence in our election system, just 21% of voters are following news about election reform Very Closely. That total includes 30% of Democrats, 22% of Republicans and 15% of Independent voters.
Data released earlier showed that 80% favor requiring voters to show a photo ID before casting a ballot. Additionally, 85% also favor a requirement for states to clean voter rolls by removing people who have died or moved from the voter registration lists. Another popular reform–supported by 76% of voters– is to requiring all ballots to be received by Election Day.
All three of those reforms are favored by a solid majority of every measured demographic group.
Eighty-percent (80%) of voters favor requiring voters to show a photo ID before casting a ballot. A Scott Rasmussen national survey found that 85% also favor a requirement for states to clean voter rolls by removing people who have died or moved from the voter registration lists. Additionally, 76% favor requiring all ballots to be received by Election Day.
All three reforms are favored by a solid majority of every measured demographic group.
Support for photo ID requirements comes from 91% of Republicans, 77% of Democrats, and 75% of Independent voters.
Eighty-six percent (86%) of White voters favor photo ID requirements along with 71% of Hispanic voters and 65% of Black voters.
Eighty-four percent (84%) of voters believe that the goal of election reform should be to create a system where it is “easy to vote and hard to cheat.” A Scott Rasmussen national survey found that 10% disagree and 5% are not sure.
While there is broad agreement on the objective, voters are divided on which half of the objective deserves a higher priority at this time. Fifty percent (50%) say making it hard to cheat is the top priority while 38% take the opposite view.
Seventy-three percent (73%) of Republicans think making it harder to cheat is the top goal. Among Democrats, 67% believe the priority should be making it easier to vote. As for Independent voters, 48% say making it harder to cheat is more important while 35% believe reformers should focus on making it easier to vote.
Overall, 33% of voters trust the GOP more than Democrats on election reform while 30% have more trust in Democrats. Twenty percent (20%) don’t trust either party while 12% trust both equally.
The survey of 1,200 Registered Voters was conducted January 11-12, 2022. The Margin of Sampling error for the full sample is +/- 2.8 percentage points.
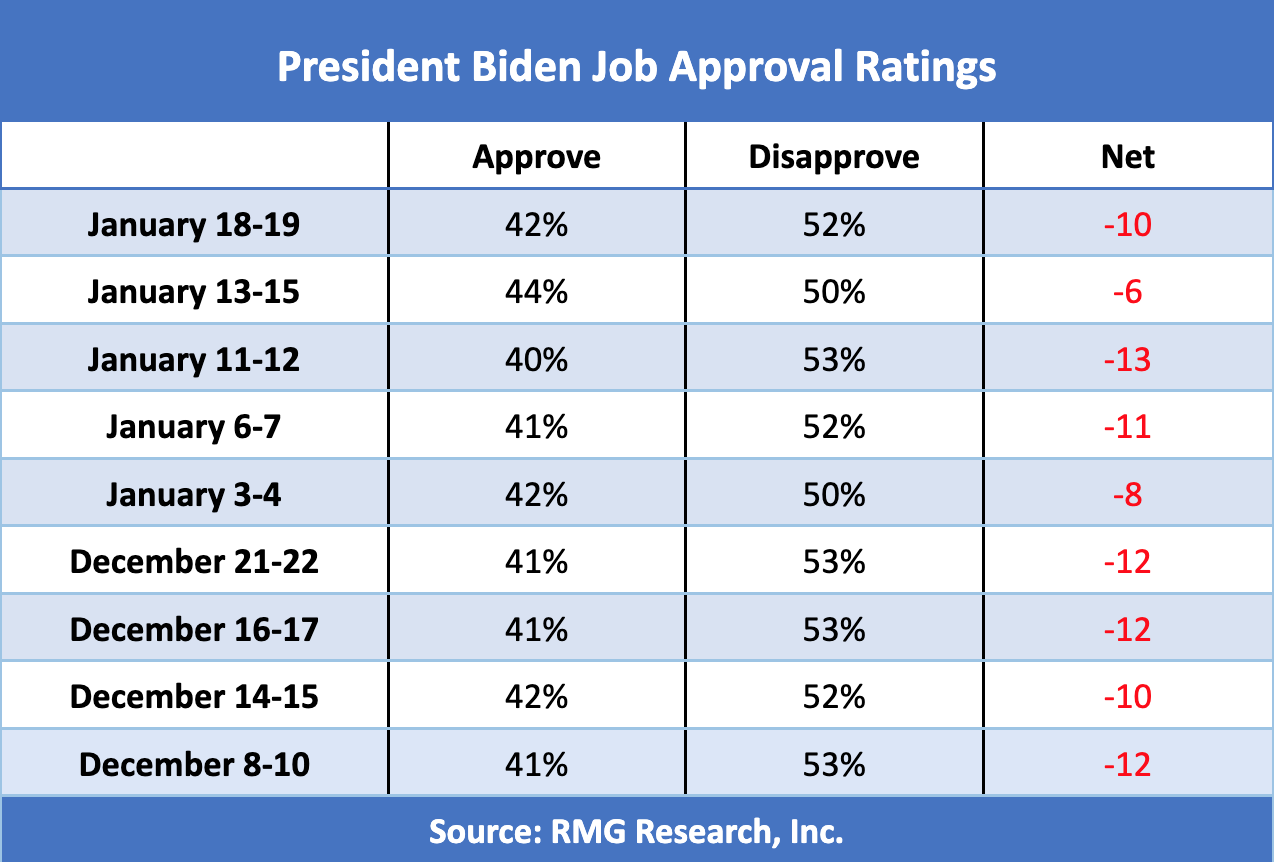
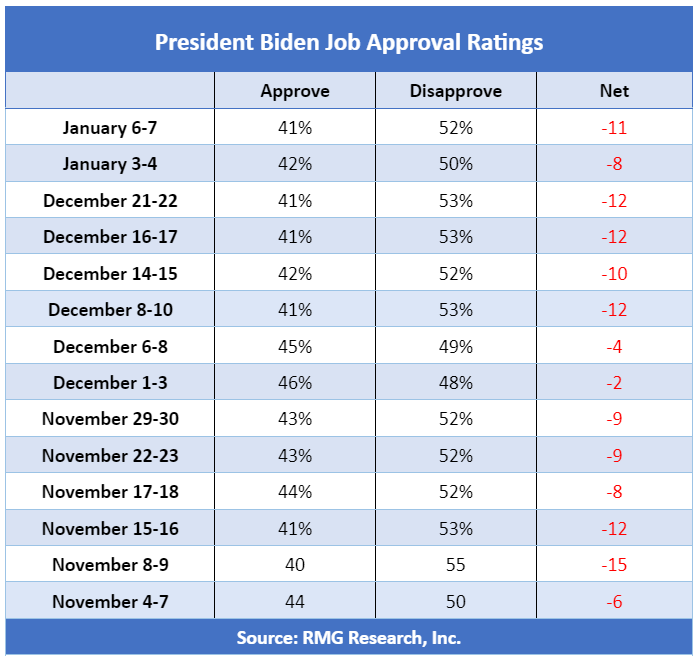
Forty-one percent (41%) of voters nationwide now approve of the way President Biden is performing his job. The latest Scott Rasmussen survey finds that 52% disapprove and 7% are not sure.
The current totals include 18% of voters who Strongly Approve of the president’s performance while 38% Strongly Disapprove.
Since December 8, six consecutive Scott Rasmussen national surveys have found the president’s Job Approval rating at either 41% or 42%.
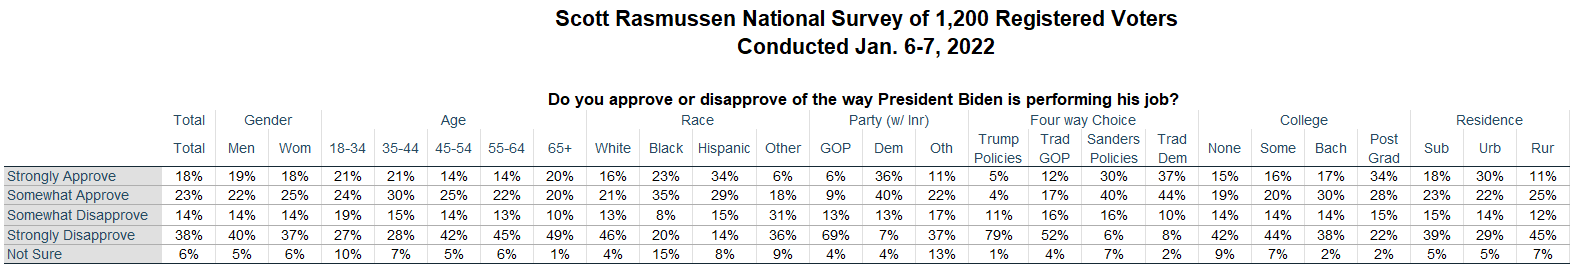
Sixty-two percent (62%) of those with a college degree approve of the way the president is performing his job. A majority of all other voters disapprove.
Overall, economic confidence has declined rapidly in recent months. That may be one reason that 57% of voters favor making the Trump tax cuts permanent.
Note: Neither Scott Rasmussen, ScottRasmussen.com, nor RMG Research, Inc. have any affiliation with Rasmussen Reports. While Scott Rasmussen founded that firm, he left nearly a decade ago and has had no involvement since that time.
Question:
Do you approve or disapprove of the way President Biden is performing his job?
18% Strongly approve
23% Somewhat approve
14% Somewhat disapprove
38% Strongly disapprove
6% Not sure
Methodology
The survey of 1,200 Registered Voters was conducted online by Scott Rasmussen on January 6-7, 2022. Field work for the survey was conducted by RMG Research, Inc. Certain quotas were applied, and the sample was lightly weighted by geography, gender, age, race, education, internet usage, and political party to reasonably reflect the nation’s population of Registered Voters. Other variables were reviewed to ensure that the final sample is representative of that population.
The margin of sampling error for the full sample is +/- 2.8 percentage points.
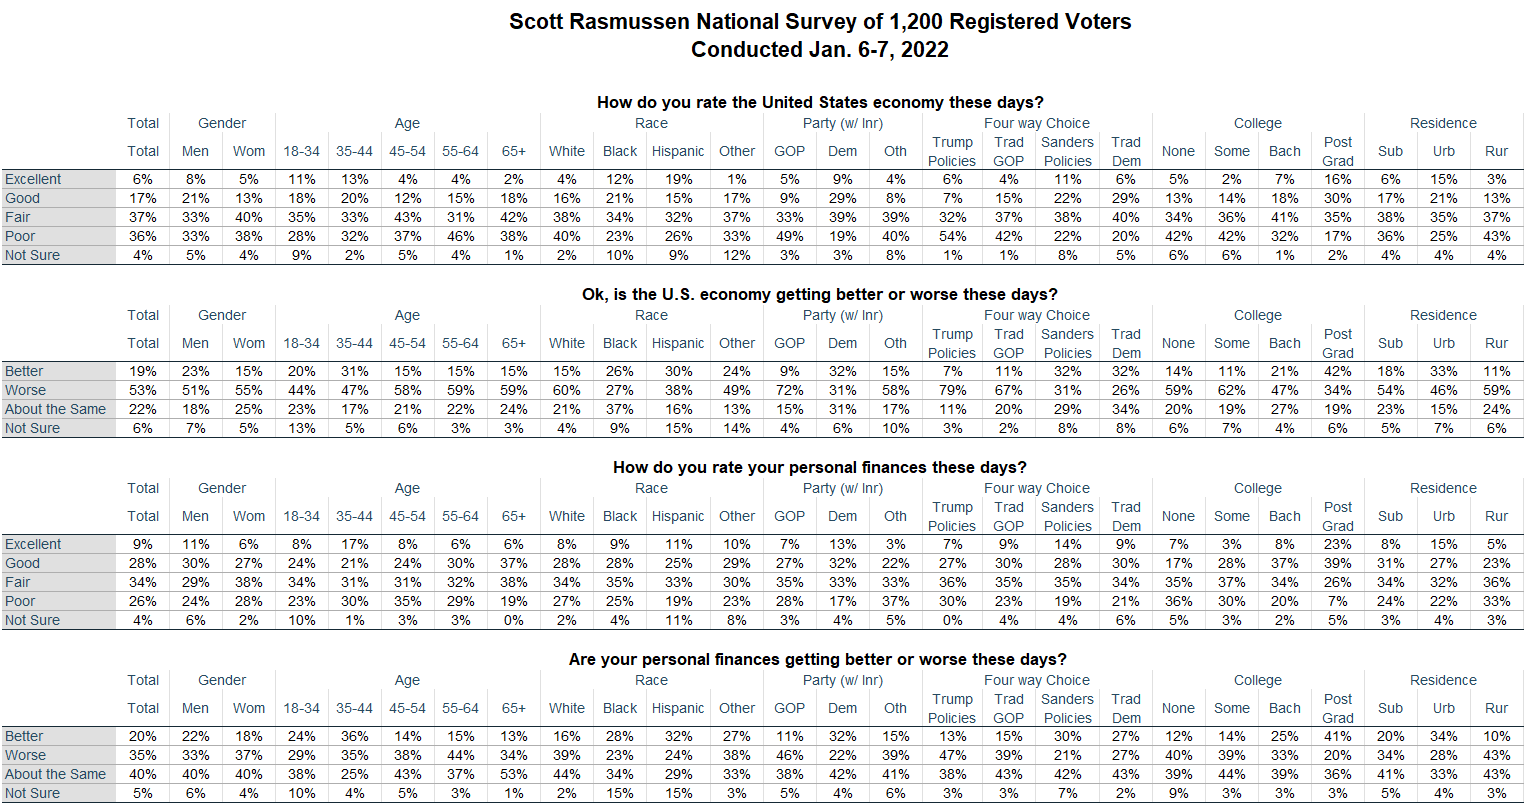
Thirty-seven percent (37%) of voters rate their own personal finances as good or excellent. That’s down twelve points over the past eight months. The latest Scott Rasmussen national survey found that 26% say poor. That figure is up twelve points since last April.
The survey conducted in April 2021 found that 28% believed their own finances were getting better while 21% said worse (net +7). The current numbers show a significantly more negative assessment: 20% now say their finances are getting better while 35% say worse (net -15).
Sixty-two percent (62%) of those with a postgraduate degree rate their own finances as good or excellent. A majority of all other voters say their finances are either fair or poor.
By a 41% to 20%, those with a high level of formal education say their finances are getting better. A solid plurality of all other voters say their finances are getting worse.
Note: Neither Scott Rasmussen, ScottRasmussen.com, nor RMG Research, Inc. have any affiliation with Rasmussen Reports. While Scott Rasmussen founded that firm, he left nearly a decade ago and has had no involvement since that time.
Question 1:
How do you rate the United States economy these days?
6% Excellent
17% Good
37% Fair
36% Poor
4% Not sure
Question 2:
Ok, is the U.S. economy getting better or worse these days?
19% Better
53% Worse
22% About the same
6% Not sure
Question 3:
How do you rate your personal finances these days?
9% Excellent
28% Good
34% Fair
26% Poor
4% Not sure
Question 4:
Are your personal finances getting better or worse these days?
20% Better
35% Worse
40% About the same
5% Not sure
Methodology
The survey of 1,200 Registered Voters was conducted online by Scott Rasmussen on January 6-7, 2022. Field work for the survey was conducted by RMG Research, Inc. Certain quotas were applied, and the sample was lightly weighted by geography, gender, age, race, education, internet usage, and political party to reasonably reflect the nation’s population of Registered Voters. Other variables were reviewed to ensure that the final sample is representative of that population.
The margin of sampling error for the full sample is +/- 2.8 percentage points.
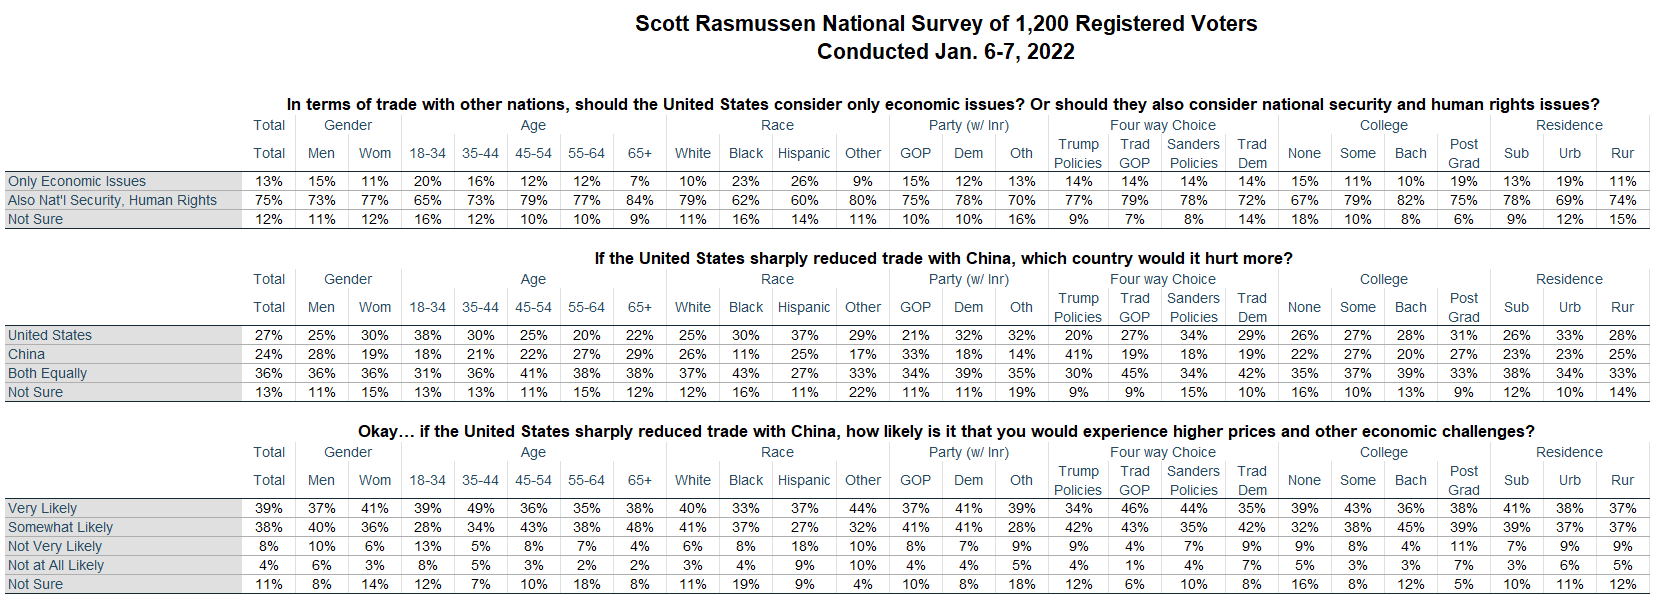
In terms of trade with other nations, 13% of voters believe the United States should consider only economic issues. A Scott Rasmussen national survey found that 75% believe national security and human rights issues should also be considered.
A solid majority of every measured demographic group favors consideration of more than economic factors.
If the United States sharply reduced trade with China, 27% believe it would hurt the U.S. more than China while 24% have the opposite view. A plurality (36%) believes both would be equally hurt.
However, 77% of voters consider it at least somewhat likely that reducing trade with China would lead to higher prices and other economic challenges.
Note: Neither Scott Rasmussen, ScottRasmussen.com, nor RMG Research, Inc. have any affiliation with Rasmussen Reports. While Scott Rasmussen founded that firm, he left more than seven years ago and has had no involvement since that time.
Question 1:
In terms of trade with other nations, should the United States consider only economic issues? Or should they also consider national security and human rights issues?
13% Only economic issues
75% Also include national security and human rights issues
12% Not sure
Question 2:
If the United States sharply reduced trade with China, which country would it hurt more?
27% The United States
24% China
36% Both equally
13% Not sure
Question 3:
Okay… if the United States sharply reduced trade with China, how likely is it that you would experience higher prices and other economic challenges?
39% Very likely
38% Somewhat likely
8% Not very likely
4% Not at all likely
11% Not sure
Methodology
The survey of 1,200 Registered Voters was conducted online by Scott Rasmussen on January 6-7, 2022. Field work for the survey was conducted by RMG Research, Inc. Certain quotas were applied, and the sample was lightly weighted by geography, gender, age, race, education, internet usage, and political party to reasonably reflect the nation’s population of Registered Voters. Other variables were reviewed to ensure that the final sample is representative of that population.
The margin of sampling error for the full sample is +/- 2.8 percentage points.
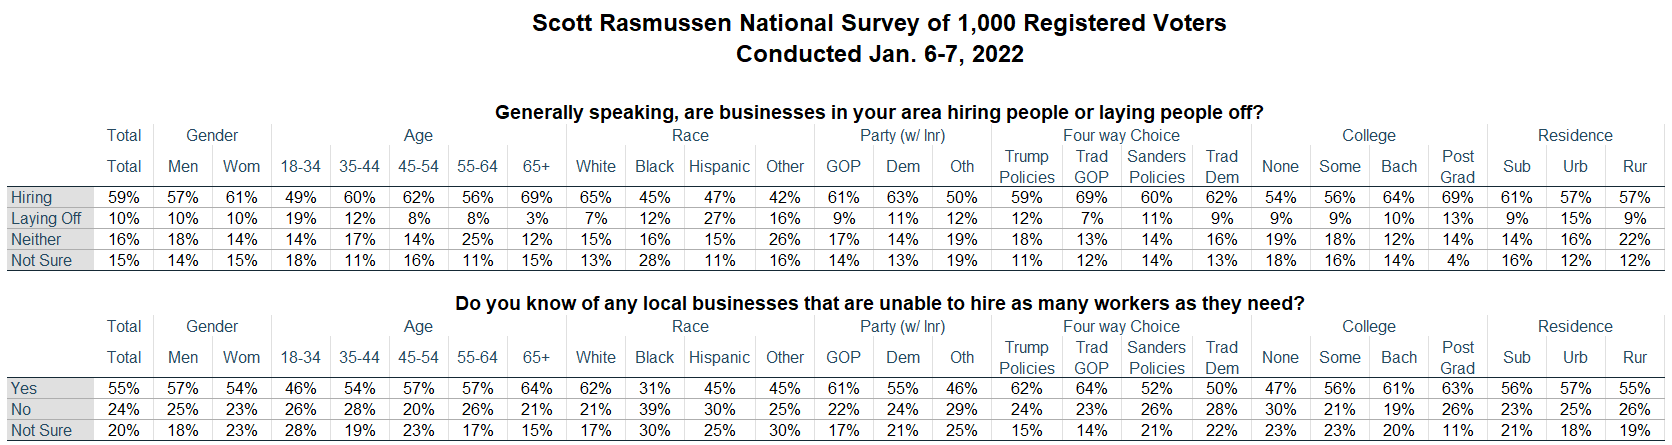
Fifty-five percent (55%) of voters know of local businesses that are unable to hire as many workers as they need. A Scott Rasmussen national survey found that 24% do not know of any such businesses in their area while 20% are not sure.
The survey also found that 59% say businesses in their area are hiring people while just 10% say they are laying people off. Sixteen percent (16%) report that neither is happening in their area and 15% are not sure.
Under normal circumstances, that strong awareness of companies hiring would be a very positive economic indicator. The numbers are more positive than ever before recorded in a Scott Rasmussen survey. However, it is more difficult to interpret those results in light of the fact that a majority of voters know of businesses that can’t find enough workers.
Note: Neither Scott Rasmussen, ScottRasmussen.com, nor RMG Research, Inc. have any affiliation with Rasmussen Reports. While Scott Rasmussen founded that firm, he left more than seven years ago and has had no involvement since that time.
Question 1:
Generally speaking, are businesses in your area hiring people or laying people off?
59% Hiring
10% Laying off
16% Neither
15% Not sure
Question 2:
Do you know of any local businesses that are unable to hire as many workers as they need?
55% Yes
24% No
20% Not sure
Methodology
The survey of 1,000 Registered Voters was conducted online by Scott Rasmussen on January 6-7, 2022. Field work for the survey was conducted by RMG Research, Inc. Certain quotas were applied, and the sample was lightly weighted by geography, gender, age, race, education, internet usage, and political party to reasonably reflect the nation’s population of Registered Voters. Other variables were reviewed to ensure that the final sample is representative of that population.
The margin of sampling error for the full sample is +/- 3.1 percentage points.
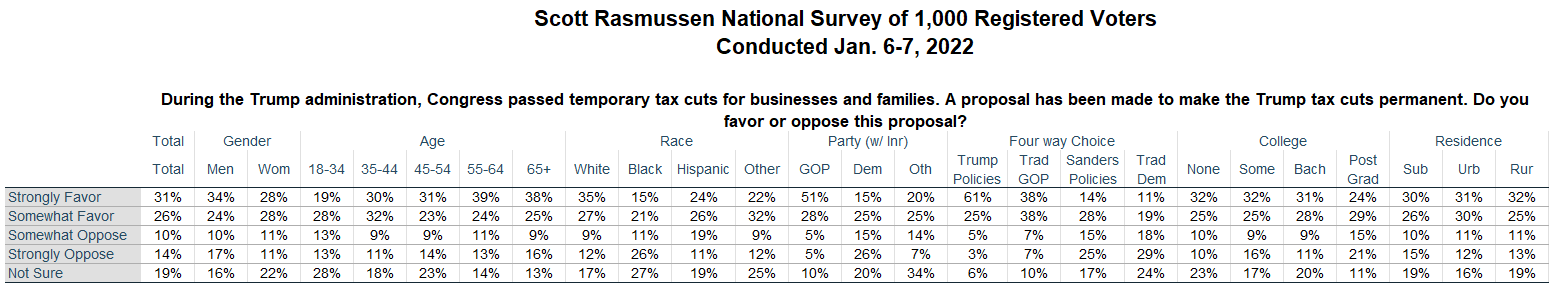
During the Trump administration, Congress passed temporary tax cuts for businesses and families. Fifty-seven percent (57%) of voters favor making the Trump tax cuts permanent. A Scott Rasmussen national survey found that 24% are oppose and 19% are not sure.
The totals include 31% who Strongly Favor making the tax cuts permanent and 14% who are Strongly Opposed.
Seventy-nine percent (79%) of Republicans favor making the Trump tax cuts permanent. Independent voters, by a 45% to 21% margin, agree. Democrats are evenly divided.
Younger voters are less supportive of tax cuts than their elders. Still, by a 47% to 26% margin, voters under 35 would like to see the Trump tax cuts made permanent.
Support for making the tax cuts permanent is found among 60% of Red State voters, 57% of Purple State voters, and 54% of Blue State voters.
Note: Neither Scott Rasmussen, ScottRasmussen.com, nor RMG Research, Inc. have any affiliation with Rasmussen Reports. While Scott Rasmussen founded that firm, he left more than seven years ago and has had no involvement since that time.
Question:
During the Trump administration, Congress passed temporary tax cuts for businesses and families. A proposal has been made to make the Trump tax cuts permanent. Do you favor or oppose this proposal?
31% Strongly favor
26% Somewhat favor
10% Somewhat oppose
14% Strongly oppose
19% Not sure
Methodology
The survey of 1,000 Registered Voters was conducted online by Scott Rasmussen on January 6-7, 2022. Field work for the survey was conducted by RMG Research, Inc. Certain quotas were applied, and the sample was lightly weighted by geography, gender, age, race, education, internet usage, and political party to reasonably reflect the nation’s population of Registered Voters. Other variables were reviewed to ensure that the final sample is representative of that population.
The margin of sampling error for the full sample is +/- 3.1 percentage points.
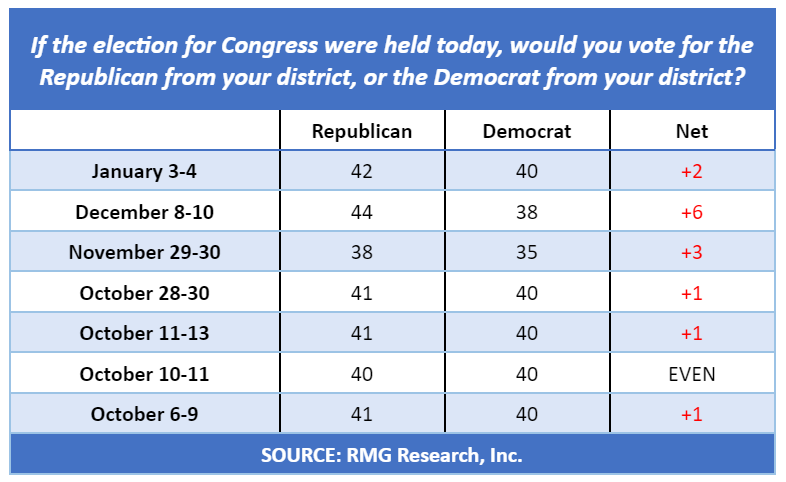
If the midterm elections were held today, 42% of Registered Voters would cast their ballot for a Republican while 40% would vote for a Democrat. The latest Scott Rasmussen national survey found that 8% would vote for some other candidate and 10% are not sure.
These results include “leaners.” They are people who initially express no preference for either party. However, on a follow-up question, they indicate a preference if they had to make a choice right now. Without leaners, the Republican advantage on this latest survey was two percentage points this month and three percentage points in December.
It is important to note that these totals are for Registered Voters and do not account for intensity of support or intention to vote. Generally speaking, Republicans and conservatives show more enthusiasm about the midterms than Democrats and progressives.
Last month, the GOP held a six point advantage on the Generic Ballot.
Looking back a bit further, Democrats never trailed on the Generic Ballot from the beginning of the year through September. Since October, however, it is the Republican Party that has never trailed.
Given a choice between four presidential candidates with equal skills and temperament. 32% would prefer a Republican who supported policies like President Trump; 23% would favor a traditional Democrat; 18% are looking for a Democrat who supported policies similar to Senator Bernie Sanders; and, 15% are ready to support a traditional Republican?
Other recent survey data showed that 84% of voters believe public schools should teach the truth about slavery. At the same time, 81% believe public schools should teach that America was founded on the ideals of freedom, equality, and self-governance.
Note: Neither Scott Rasmussen, ScottRasmussen.com, nor RMG Research, Inc. have any affiliation with Rasmussen Reports. While Scott Rasmussen founded that firm, he left more than seven years ago and has had no involvement since that time.
Question 1:
If the election for Congress were held today, would you vote for the Republican from your district, or the Democrat from your district?
42% Republican
40% Democrat
8% Other
10% Not sure
Question 2:
Suppose you had a choice between four presidential candidates. All four had equal skills and temperament. Would you prefer a Republican who supported policies like President Trump, a more traditional Republican, a Democrat who supported policies similar to Senator Bernie Sanders, or a more traditional Democrat?
32% A Republican supporting Trump’s policies
15% A more traditional Republican
18% A Democrat supporting Sanders’ policies
23% A more traditional Democrat
12% Not sure
Methodology
The survey of 1,000 Registered Voters was conducted online by Scott Rasmussen on January 3-4, 2022. Field work for the survey was conducted by RMG Research, Inc. Certain quotas were applied, and the sample was lightly weighted by geography, gender, age, race, education, internet usage, and political party to reasonably reflect the nation’s population of Registered Voters. Other variables were reviewed to ensure that the final sample is representative of that population.
The margin of sampling error for the full sample is +/- 3.1 percentage points.
Note: Neither Scott Rasmussen, ScottRasmussen.com, nor RMG Research, Inc. have any affiliation with Rasmussen Reports. While Scott Rasmussen founded that firm, he left more than seven years ago and has had no involvement since that time.
Methodology
The survey of 1,000 Registered Voters was conducted online by Scott Rasmussen on January 3-4, 2022. Field work for the survey was conducted by RMG Research, Inc. Certain quotas were applied, and the sample was lightly weighted by geography, gender, age, race, education, internet usage, and political party to reasonably reflect the nation’s population of Registered Voters. Other variables were reviewed to ensure that the final sample is representative of that population.
The margin of sampling error for the full sample is +/- 3.1 percentage points.
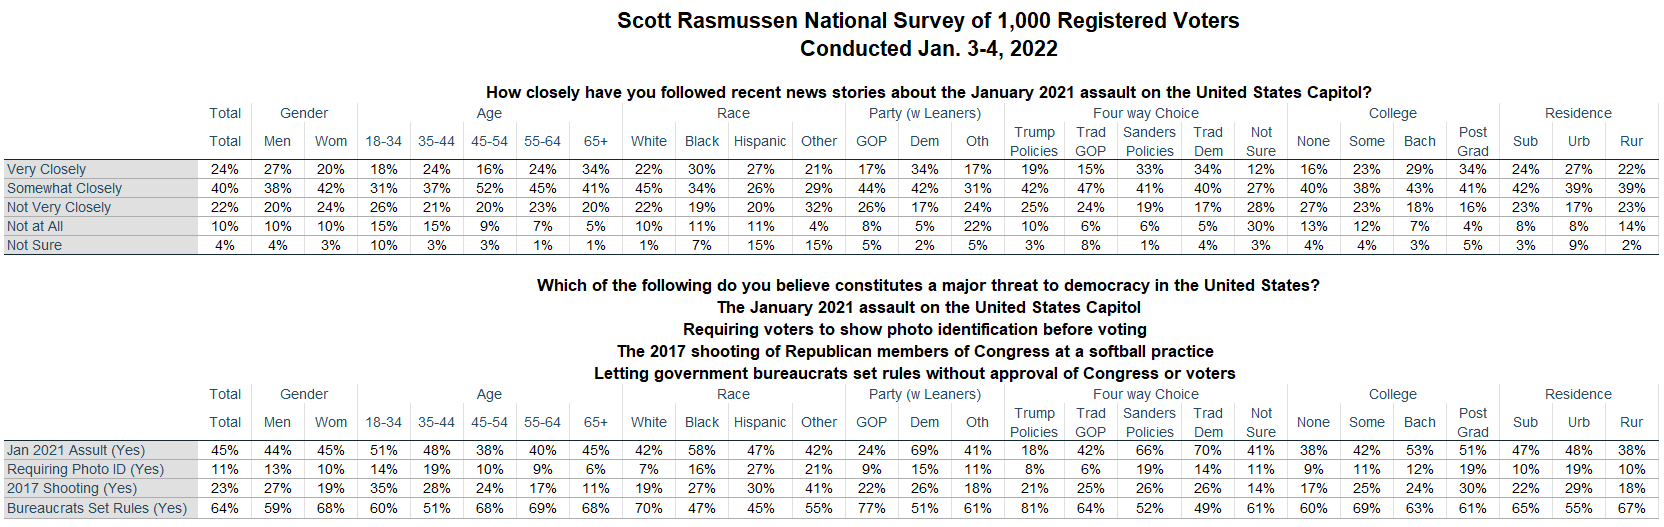
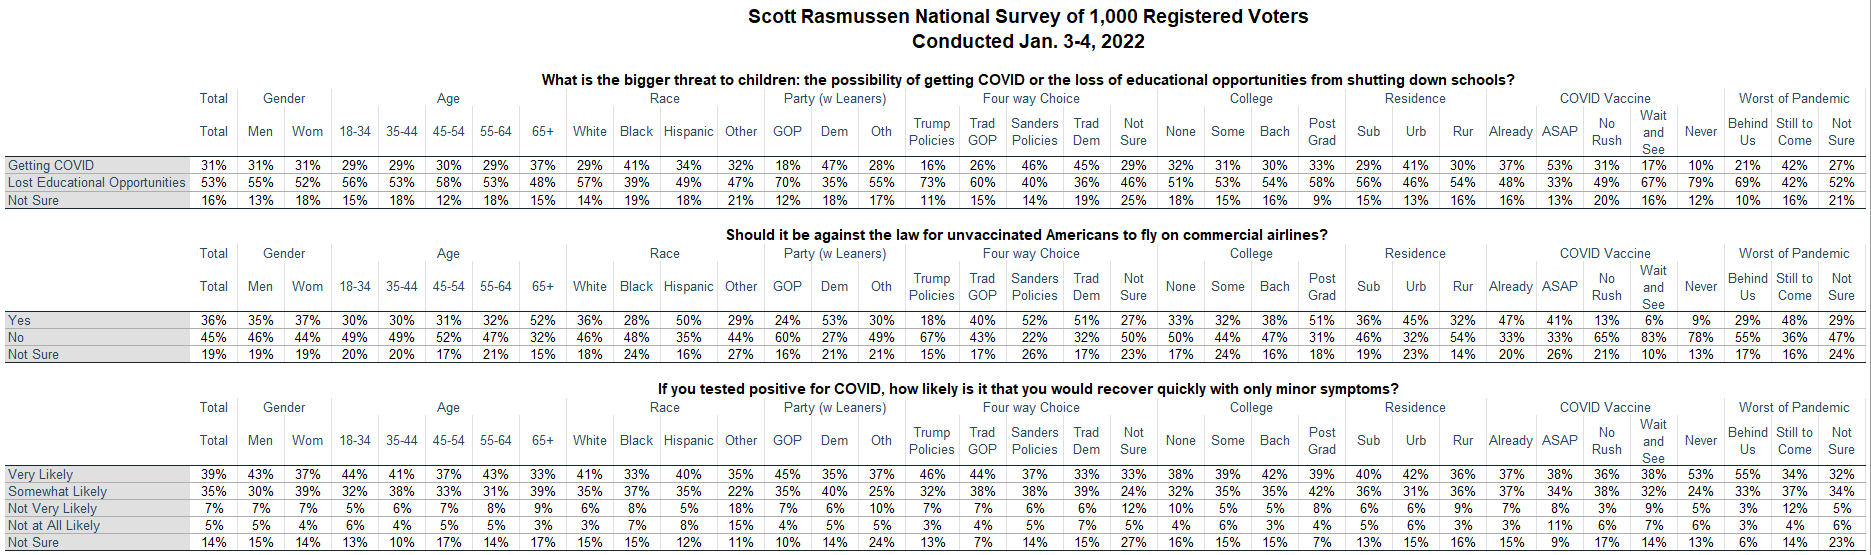
Fifty-three percent (53%) of voters believe the loss of educational opportunities from shutting down schools is a bigger threat to children than the possibility of getting COVID. A Scott Rasmussen national survey found that 31% disagree and believe COVID is the bigger threat.
Republicans overwhelmingly see the loss of educational opportunities as the bigger threat. Independent voters agree by a 2-to-1 margin.
Democrats, however, disagree. By a 47% to 35% margin, those in President Biden’s party see the possibility of getting COVID as the bigger threat.
The survey also found that 36% believe it should be against the law for unvaccinated Americans to fly on commercial airlines. Forty-five percent (45%) disagree.
There is also a significant divide on this question. Democrats, by a 2-to-1 margin, believe it should be against the law for the unvaccinated to fly. Republicans disagree by an even wider margin (60% to 24%). Among Independents, 30% believe it should be against the law while 49% disagree.
Note: Neither Scott Rasmussen, ScottRasmussen.com, nor RMG Research, Inc. have any affiliation with Rasmussen Reports. While Scott Rasmussen founded that firm, he left more than seven years ago and has had no involvement since that time.
Question 1:
What is the bigger threat to children: the possibility of getting COVID or the loss of educational opportunities from shutting down schools?
31% Getting COVID
53% Loss of educational opportunities
16% Not sure
Question 2:
Should it be against the law for unvaccinated Americans to fly on commercial airlines?
36% Yes
45% No
19% Not sure
Question 3:
If you tested positive for COVID, how likely is it that you would recover quickly with only minor symptoms?
39% Very likely
35% Somewhat likely
7% Not very likely
5% Not at all likely
14% Not sure
Methodology
The survey of 1,000 Registered Voters was conducted online by Scott Rasmussen on January 3-4, 2022. Field work for the survey was conducted by RMG Research, Inc. Certain quotas were applied, and the sample was lightly weighted by geography, gender, age, race, education, internet usage, and political party to reasonably reflect the nation’s population of Registered Voters. Other variables were reviewed to ensure that the final sample is representative of that population.
The margin of sampling error for the full sample is +/- 3.1 percentage points.
When fighting the COVID pandemic, 54% of voters believe the focus should be on balancing health care concerns with social, lifestyle, and economic concerns. A Scott Rasmussen national survey found that 34% disagree and believe it is more important to stop COVID at all costs.
Sixty-six percent (66%) of Republicans believe a balanced approach is best. Independent voters, by a 49% to 35% margin, tend to agree. Democrats are evenly divided.
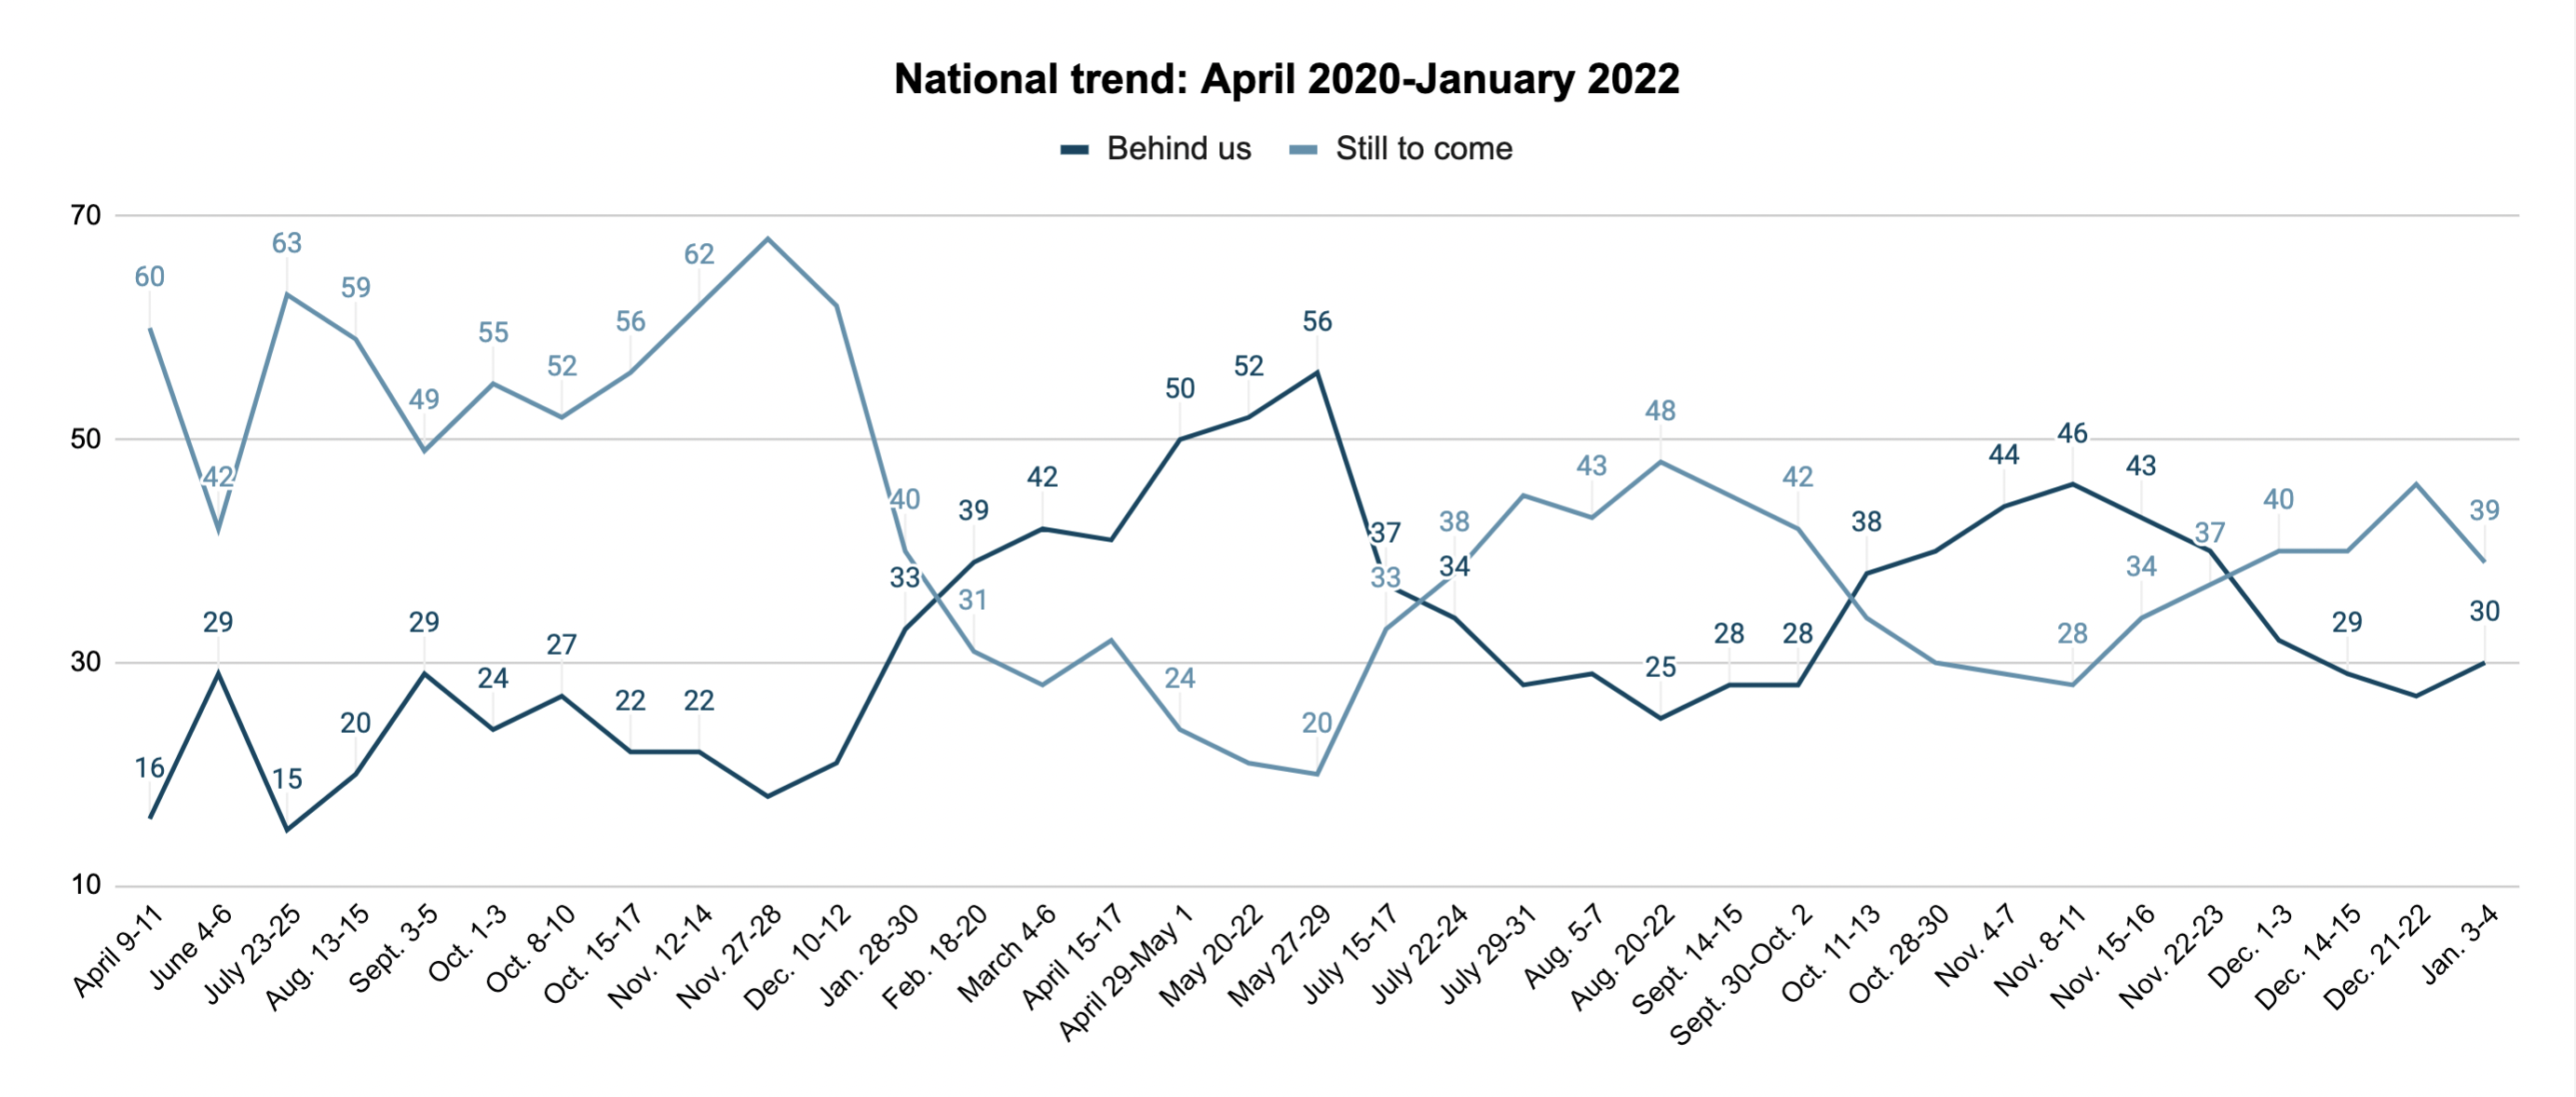
The survey also found that 30% of voters now believe the worst of the pandemic is behind us while 39% believe it is still to come.
Note: Neither Scott Rasmussen, ScottRasmussen.com, nor RMG Research, Inc. have any affiliation with Rasmussen Reports. While Scott Rasmussen founded that firm, he left more than seven years ago and has had no involvement since that time.
Question 1:
Which of the following best describes your reaction to taking the COVID vaccine?
66% I have already been vaccinated.
3% I want to be vaccinated as soon as possible.
6% I want to wait and see how it works before getting vaccinated.
9% I’m in no particular rush to get vaccinated.
13% I will never get vaccinated.
3% Not sure
Question 2:
Is the worst of the pandemic behind us, or is it still to come?
30% Behind us
39% Still to come
30% Not sure
Question 3:
Is it more important to stop COVID at all costs or to balance health care concerns with social, lifestyle, and economic concerns?
34% Stop COVID at all costs
54% Balance concerns
12% Not sure
Methodology
The survey of 1,000 Registered Voters was conducted online by Scott Rasmussen on January 3-4, 2022. Field work for the survey was conducted by RMG Research, Inc. Certain quotas were applied, and the sample was lightly weighted by geography, gender, age, race, education, internet usage, and political party to reasonably reflect the nation’s population of Registered Voters. Other variables were reviewed to ensure that the final sample is representative of that population.
Fifty-seven percent (57%) of voters believe that Joe Biden was legitimately elected president in 2020. A Scott Rasmussen national survey found that a similar number –61%–believe Donald Trump was legitimately elected president in 2016. Just 26% of voters believe the proper winner was declared in each of those elections.
Fifty-five percent (55%) of voters believe activists and politicians in both political parties would steal an election if they could get away with it. Thirty-three percent (33%) disagree.
Most Republicans and Independents believe both sides would steal an election if they could. Democrats are evenly divided on the question.
Among those who prefer policies advocated by former President Trump, just 19% have a favorable opinion of those who broke into the Capitol. Sixty-one percent (61%) offer an unfavorable view.
Note: Neither Scott Rasmussen, ScottRasmussen.com, nor RMG Research, Inc. have any affiliation with Rasmussen Reports. While Scott Rasmussen founded that firm, he left more than seven years ago and has had no involvement since that time.
Question 1:
Who do you believe was the legitimate winner of the 2016 presidential election—Hillary Clinton or Donald Trump?
24% Hillary Clinton
61% Donald Trump
15% Not sure
Question 2:
Okay… Who do you believe was the legitimate winner of the 2020 presidential election—Joe Biden or Donald Trump?
57% Joe Biden
31% Donald Trump
12% Not sure
Question 3:
Do you agree or disagree with the following statement: “Political activists and candidates in both political parties are willing to steal an election if they can get away with it.”
25% Strongly agree
30% Somewhat agree
17% Somewhat disagree
16% Strongly disagree
12% Not sure
Methodology
The survey of 1,000 Registered Voters was conducted online by Scott Rasmussen on January 3-4, 2022. Field work for the survey was conducted by RMG Research, Inc. Certain quotas were applied, and the sample was lightly weighted by geography, gender, age, race, education, internet usage, and political party to reasonably reflect the nation’s population of Registered Voters. Other variables were reviewed to ensure that the final sample is representative of that population.
Thirteen percent (13%) of voters have a favorable opinion of those who broke into the U.S. Capitol on January 6, 2021. A Scott Rasmussen national survey found that 77% have an unfavorable view.
Among those who prefer policies advocated by former President Trump, just 19% have a favorable opinion of those who broke into the Capitol. Sixty-one percent (61%) offer an unfavorable view.
Thirty-two percent (32%) of voters think it’s Very Likely that democracy in America will end in the next generation or so. A Scott Rasmussen national survey found that total includes 11% who believe it has already ended. Republicans are significantly more worried about democracy ending than Democrats.
Additionally, 37% of all voters see Democrats as a bigger threat to democracy than Republicans. Twenty-six percent (26%) see Republicans as the bigger threat while 20% think the two parties represent an equal threat to democracy.
Fifty-five percent (55%) of voters believe activists and politicians in both political parties would steal an election if they could get away with it. Thirty-three percent (33%) disagree.
Note: Neither Scott Rasmussen, ScottRasmussen.com, nor RMG Research, Inc. have any affiliation with Rasmussen Reports. While Scott Rasmussen founded that firm, he left more than seven years ago and has had no involvement since that time.
Question 1:
Thinking back, do you approve or disapprove of the Trump supporters who broke into the United States Capitol on January 6, 2021?
5% Strongly approve
8% Somewhat approve
14% Somewhat disapprove
63% Strongly disapprove
10% Not sure
Question 2:
Think for a moment about the 74 million people who voted for Donald Trump in 2020. Did most Trump voters support those who occupied the Capitol, or were they opposed to such efforts?
26% Supported
38% Opposed
36% Not sure
Methodology
The survey of 1,000 Registered Voters was conducted online by Scott Rasmussen on January 3-4, 2022. Field work for the survey was conducted by RMG Research, Inc. Certain quotas were applied, and the sample was lightly weighted by geography, gender, age, race, education, internet usage, and political party to reasonably reflect the nation’s population of Registered Voters. Other variables were reviewed to ensure that the final sample is representative of that population.
The margin of sampling error for the full sample is +/- 3.1 percentage points.
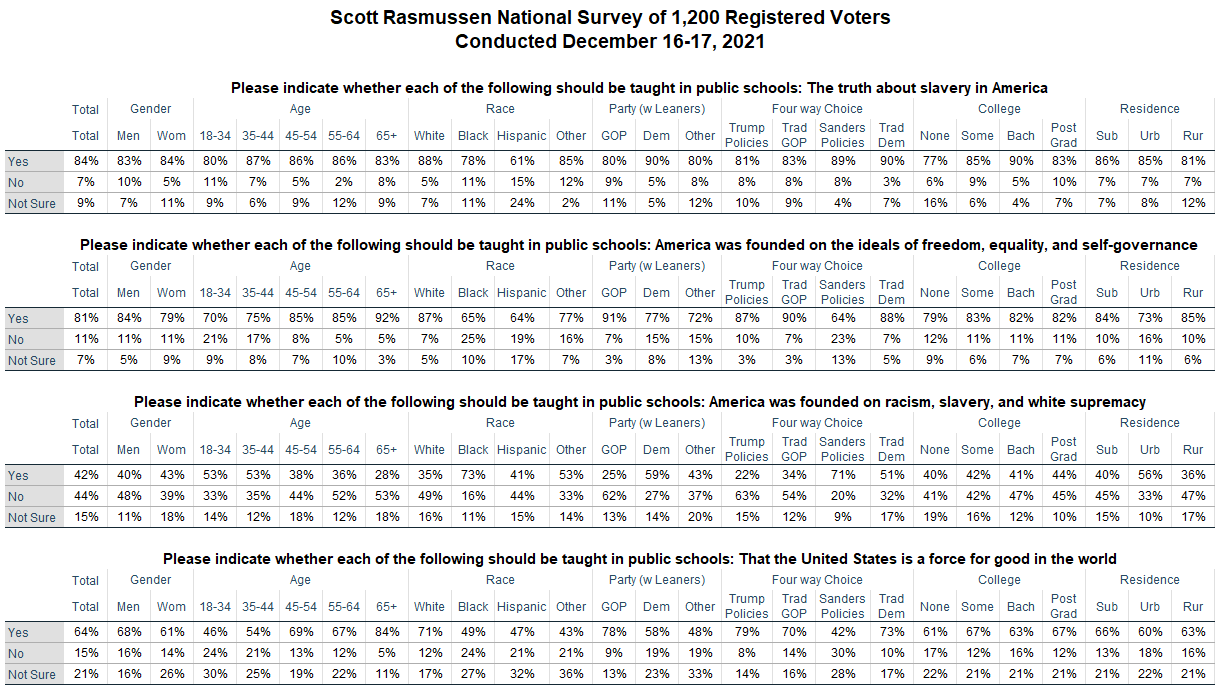
Eighty-four percent (84%) of voters believe public schools should teach the truth about slavery. At the same time, a Scott Rasmussen national survey found that 81% believe public schools should teach that America was founded on the ideals of freedom, equality, and self-governance.
Combining the results shows that 72% of voters believe both should be taught.
Another question found that 42% believe the schools should teach that America was founded on racism, slavery, and white supremacy. Forty-four percent (44%) disagree.
Overall, 40% believe students should be taught that America was founded on noble ideals, but not that the nation was founded on racism. Thirty percent (30%) believe both should be taught. Eleven percent (11%) say that the noble ideals should be taught and are not sure about racism. Nine percent (9%) believe schools should teach that the nation was founded on racism but not that it was founded upon noble ideals.
Finally, 64% believe that schools should teach that America is a force for good in the world. Fifteen percent (15%) disagree and 21% are not sure.
Seventy-nine percent (79%) of those who support Trump-like policies believe that students should be taught that America is a force for good. So do 73% of traditional Democrats and 70% of traditional Republicans.
However, among those who support policies like those of Senator Bernie Sanders, just 42% think students should learn that America is a force for good. Thirty percent (30%) of Sanders’ supporters say that positive message should not be taught while 28% are not sure.
Given a choice between four presidential candidates with equal skills and temperament, 31% would prefer a Republican who supported policies like those of President Trump. A Scott Rasmussen national survey found that 20% would prefer a Democrat who supported policies similar to Senator Bernie Sanders, 19% favor a more traditional Democrat, and 17% a more traditional Republican.
Note: Neither Scott Rasmussen, ScottRasmussen.com, nor RMG Research, Inc. have any affiliation with Rasmussen Reports. While Scott Rasmussen founded that firm, he left more than seven years ago and has had no involvement since that time.
Question 1:
Please indicate whether each of the following should be taught in public schools: The truth about slavery in America
84% Yes
7% No
9% Not sure
Question 2:
Please indicate whether each of the following should be taught in public schools: America was founded on the ideals of freedom, equality, and self-governance
81% Yes
11% No
7% Not sure
Question 3:
Please indicate whether each of the following should be taught in public schools: America was founded on racism, slavery, and white supremacy
42% Yes
44% No
15% Not sure
Question 4:
Please indicate whether each of the following should be taught in public schools: That the United States is a force for good in the world
64% Yes
15% No
21% Not sure
Methodology
The survey of 1,200 Registered Voters was conducted online by Scott Rasmussen on December 16-17, 2021. Field work for the survey was conducted by RMG Research, Inc. Certain quotas were applied, and the sample was lightly weighted by geography, gender, age, race, education, internet usage, and political party to reasonably reflect the nation’s population of Registered Voters. Other variables were reviewed to ensure that the final sample is representative of that population.
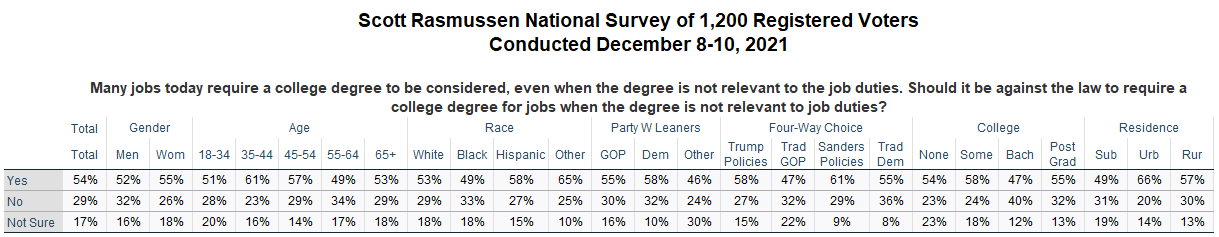
Fifty-four percent (54%) of voters believe it should be against the law to require a college degree for jobs when the degree is not relevant to job duties. A Scott Rasmussen national survey found that just 29% disagree and 17% are not sure.
These views are shared widely across partisan and demographic lines. However, those with a bachelor’s degree but not a postgraduate degree are less supportive. Among such voters 47% believe requiring a degree should be against the law while 40% disagree.
Fifty-five percent (55%) of those with a postgraduate degree believe it should be against the law. So do 58% of those with some college experience and 54% of those who have never attended college.
Note: Neither Scott Rasmussen, ScottRasmussen.com, nor RMG Research, Inc. have any affiliation with Rasmussen Reports. While Scott Rasmussen founded that firm, he left more than seven years ago and has had no involvement since that time.
Question:
Many jobs today require a college degree to be considered, even when the degree is not relevant to the job duties. Should it be against the law to require a college degree for jobs when the degree is not relevant to job duties?
54% Yes
29% No
17% Not sure
Methodology
The survey of 1,200 Registered Voters was conducted online by Scott Rasmussen on December 8-10, 2021. Field work for the survey was conducted by RMG Research, Inc. Certain quotas were applied, and the sample was lightly weighted by geography, gender, age, race, education, internet usage, and political party to reasonably reflect the nation’s population of Registered Voters. Other variables were reviewed to ensure that the final sample is representative of that population.
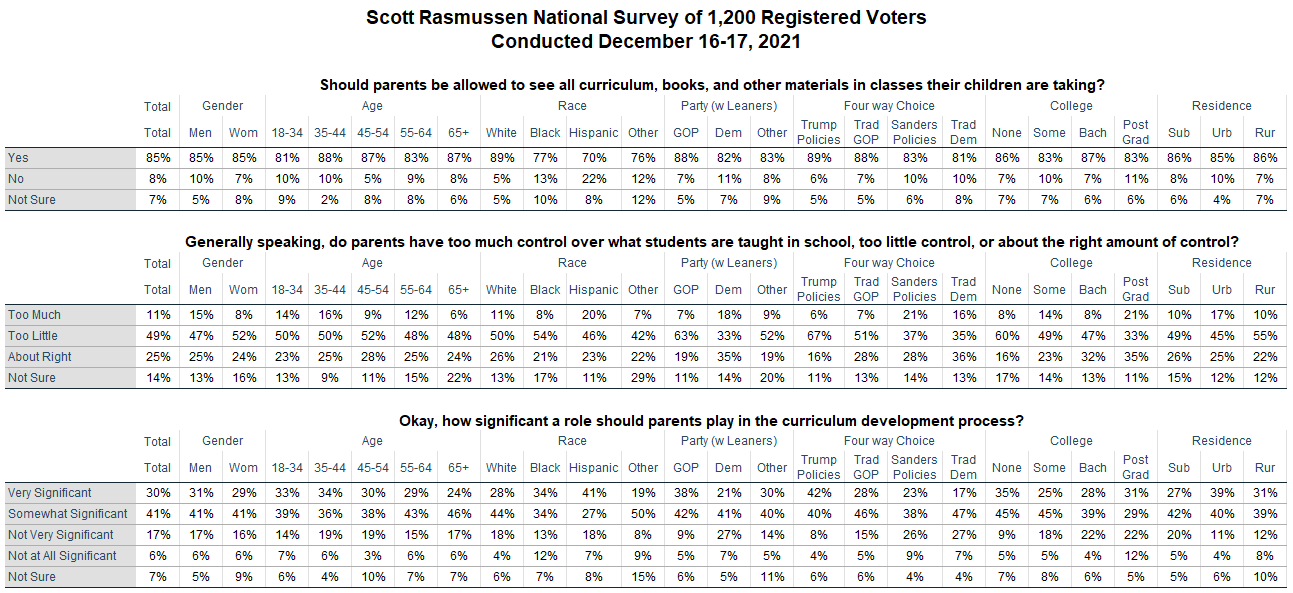
Seventy-one percent (71%) of voters believe parents should play a significant role in the curriculum development process. A Scott Rasmussen national survey found that 23% disagree and 7% are not sure.
Forty-nine percent (49%) believe that parents currently have too little control over the process while 11% believe they have too much control.
Sixty-three percent (63%) of Republicans believe parents have too little control. So do 52% of Independent voters.
As on many issues, there is a significant divide between white and black Democrats. Fifty-four percent (54%) of Black Democrats believe parents have too little control. Just 6% say they have too much control. White Democrats, however, are evenly divided. Just 26% believe parents have too little control while 21% say they have too much of an impact.
Among all voters, 85% believe parents should be allowed to see all curriculum, books, and other materials in classes their children are taking. Just 8% disagree.
Over the past year, there have been many reports of protests and conflict between parents and school boards. A Scott Rasmussen national survey found that 42% of voters generally side with the parents while 28% side with the school boards. Republicans tend to side with the parents by a 59% to 16% margin. Democrats take the opposite view and side with the school boards by a 45% to 26% margin. Among Independents, 39% side with the parents and 21% with the school boards.
Note: Neither Scott Rasmussen, ScottRasmussen.com, nor RMG Research, Inc. have any affiliation with Rasmussen Reports. While Scott Rasmussen founded that firm, he left more than seven years ago and has had no involvement since that time.
Question 1:
Should parents be allowed to see all curriculum, books, and other materials in classes their children are taking?
85% Yes
8% No
7% Not sure
Question 2:
Generally speaking, do parents have too much control over what students are taught in school, too little control, or about the right amount of control?
11% Too much
49% Too little
25% About right
14% Not sure
Question 3:
Okay, how significant a role should parents play in the curriculum development process?
30% Very significant
41% Somewhat significant
17% Not very significant
6% Not at all significant
7% Not sure
Methodology
The survey of 1,200 Registered Voters was conducted online by Scott Rasmussen on December 16-17, 2021. Field work for the survey was conducted by RMG Research, Inc. Certain quotas were applied, and the sample was lightly weighted by geography, gender, age, race, education, internet usage, and political party to reasonably reflect the nation’s population of Registered Voters. Other variables were reviewed to ensure that the final sample is representative of that population.
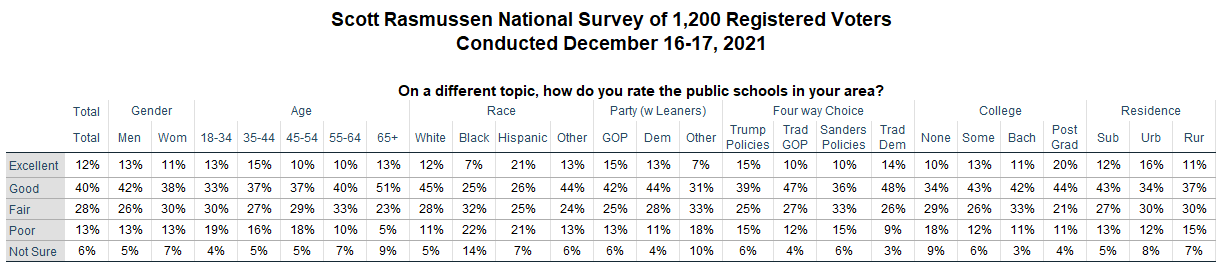
Fifty-two percent (52%) of voters rate the public schools in their area as good or excellent. A Scott Rasmussen national survey found that 28% rate those schools as fair and 13% say poor.
Fifty-seven percent (57%) of White voters rate their schools as good or excellent. That view is shared by 47% of Hispanic voters and just 32% of Black voters.
Over the past year, there have been many reports of protests and conflict between parents and school boards. A Scott Rasmussen national survey found that 42% of voters generally side with the parents while 28% side with the school boards. Republicans tend to side with the parents by a 59% to 16% margin. Democrats take the opposite view and side with the school boards by a 45% to 26% margin. Among Independents, 39% side with the parents and 21% with the school boards.
Note: Neither Scott Rasmussen, ScottRasmussen.com, nor RMG Research, Inc. have any affiliation with Rasmussen Reports. While Scott Rasmussen founded that firm, he left more than seven years ago and has had no involvement since that time.
Question:
On a different topic, how do you rate the public schools in your area?
12% Excellent
40% Good
28% Fair
13% Poor
6% Not sure
Methodology
The survey of 1,200 Registered Voters was conducted online by Scott Rasmussen on December 16-17, 2021. Field work for the survey was conducted by RMG Research, Inc. Certain quotas were applied, and the sample was lightly weighted by geography, gender, age, race, education, internet usage, and political party to reasonably reflect the nation’s population of Registered Voters. Other variables were reviewed to ensure that the final sample is representative of that population.