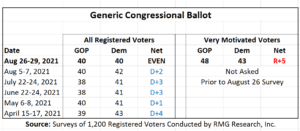
If the election were held today, 40% of Registered Voters would vote for the Democrat from their Congressional District while 40% would vote for the Republican. The latest Scott Rasmussen poll is the first time the parties have been even on this basic measure of the political environment. In five earlier surveys, Democrats led by one-to-four percentage points.
At the beginning of August, Democrats held a 42% to 40% advantage.
This month, for the first time, the survey asked about enthusiasm for voting in the midterm elections. Among those who are Very Motivated to vote, the Republicans lead by a 48% to 43% margin. This five-point edge stems largely from the fact that voters who prefer policies of President Trump are more motivated to vote than others.
Among voters who prefer Traditional Republican policies, just 55% are committed to voting for a GOP candidate. Sixteen percent (16%) say they would vote for a Democrat. However, those who want Traditional GOP policies are significantly less motivated than other voters.
The survey was conducted at a time when the Biden Administration is struggling on many fronts. As a result, it is impossible to know whether the shifts in the generic ballot reflect merely a temporary blip or are the beginning of a longer-term trend.
One major challenge for the president is that just 45% of voters have confidence in the ability of the Biden Administration to keep America safe. Following the chaotic withdrawal from Afghanistan, 49% of all voters believe that our enemies view us as weaker than before. Just 21% disagree.
The situation at the Southern border may also be a factor in the general lack of confidence. Just 28% of voters believe the federal government today is seriously trying to secure the border and reduce illegal immigration. There is a strong belief that many of those crossing the border illegally are drug dealers, human traffickers, and more.
Adding to the president’s burden, pessimism about the pandemic is growing again. Just 25% of voters believe the worst is behind us. That’s down 31 points over the past three months and the lowest level of optimism measured since the vaccines became available.
On top of all that, and perhaps because of the above issues, economic confidence has fallen.
SIGN UP to receive Scott’s free email newsletter.
CHECK OUT Scott’s latest polls.
Note: Neither Scott Rasmussen, ScottRasmussen.com, nor RMG Research, Inc. have any affiliation with Rasmussen Reports. While Scott Rasmussen founded that firm, he left more than seven years ago and has had no involvement since that time.
Methodology
The survey of 1,200 Registered Voters was conducted by Scott Rasmussen using a mixed mode approach from August 26-29, 2021. Field work for the survey was conducted by RMG Research, Inc. Most respondents were contacted online or via text while 236 were contacted using automated phone polling techniques. Online respondents were selected from a list of Registered Voters and through a process of Random Digital Engagement. Certain quotas were applied, and the sample was lightly weighted by geography, gender, age, race, education, internet usage, and political party to reasonably reflect the nation’s population of Registered Voters. Other variables were reviewed to ensure that the final sample is representative of that population.
The margin of sampling error for the full sample is +/- 2.8 percentage points.


