Americans are growing a bit less pessimistic about the pandemic.
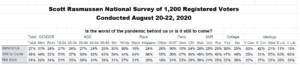
Twenty-seven percent (27%) of voters nationwide believe the worst of the pandemic is behind us. A Scott Rasmussen national survey found that 48% disagree and believe the worst is still to come.
The number who believe the worst is still to come is down seven points from a week ago and down eleven points from two weeks ago. This marks only the second time–and the first since June–that fewer that half the nation’s voters believed the worst was still to come.
The 27% who believe that the worst is behind us is up a point from last week, up seven points from two weeks ago, and up 12 points since July.
Earlier this year, from April thru June, confidence about getting the pandemic behind us grew steadily. But, in July that confidence collapsed before starting to grow again in August. If confidence continues to grow, it would be a significant benefit to President Trump’s hopes of re-election.
Republicans, by a 50% to 26% margin, believe the worst is behind us. Democrats reject that notion by a 67% to 10% margin. Among Independent voters, 24% believe the worst has come and gone while 48% take the opposite view.
Scott Rasmussen has been tracking this question on a weekly basis and will continue to do so. Results in this feature are based upon a survey of 1,200 Registered Voters conducted August 27-29, 2020.
Other data from the survey found that 59% of voters believe it’s time to move forward by adapting to the ongoing nature of the pandemic. Thirty-one percent (31%) take the opposite view and believe it is better for America to lockdown again until the pandemic is completely behind us.
LISTEN TO Scott’s Podcast.
SIGN UP to receive Scott’s free email newsletter.
CHECK OUT Scott’s latest polls.
Methodology
The survey of 1,200 Registered Voters was conducted by Scott Rasmussen using a mixed mode approach from August 27-29, 2020. Field work for the survey was conducted by RMG Research, Inc. Most respondents were contacted online or via text while 188 were contacted using automated phone polling techniques. Certain quotas were applied to the overall sample and lightly weighted by geography, gender, age, race, education, and political party to reasonably reflect the nation’s population of Registered Voters. Other variables were reviewed to ensure that the final sample is representative of that population.