48% Say Police Officers More Likely to Be Harassed Than to Abuse Their Authority

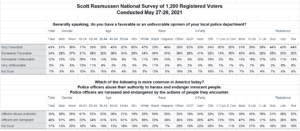
Forty-eight percent (48%) of voters believe police officers are harassed and endangered by the actions of people they encounter more than they abuse their authority. A Scott Rasmussen national survey found that 35% believe it is more common for police officers to abuse their authority to harass and endanger innocent people.

There is a massive partisan divide on this question. Seventy-five percent (75%) of Republicans believe police are more likely to be harassed and endangered. Fifty-four percent (54%) of Democrats believe police are more likely to abuse their authority.

Independent voters are more evenly divided. Forty-two percent (42%) believe police are more likely to be endangered while 32% take the opposite view.

There is also a significant racial divide: 55% of White voters believe police are more likely to be harassed and endangered. However, 55% of Hispanic voters and 54% of White voters think police officers are more likely to harass and endanger innocent people.

The survey also found that 77% of voters have a favorable opinion of their local police department. Just 17% have an unfavorable view. A majority of every measured demographic group holds a favorable opinion of their local police.

SIGN UP to receive Scott’s free email newsletter.

CHECK OUT Scott’s latest polls.

Note: Neither Scott Rasmussen, ScottRasmussen.com, nor RMG Research, Inc. have any affiliation with Rasmussen Reports. While Scott Rasmussen founded that firm, he left more than seven years ago and has had no involvement since that time.

Methodology

The survey of 1,200 Registered Voters was conducted by Scott Rasmussen using a mixed mode approach from May 27-29, 2021. Field work for the survey was conducted by RMG Research, Inc. Most respondents were contacted online or via text while 170 were contacted using automated phone polling techniques. Online respondents were selected from a list of Registered Voters and through a process of Random Digital Engagement. Certain quotas were applied, and the sample was lightly weighted by geography, gender, age, race, education, internet usage, and political party to reasonably reflect the nation’s population of Registered Voters. Other variables were reviewed to ensure that the final sample is representative of that population.

Posted in Poll Results | Tagged ,

Scott's Newsletter
Sign up for Scott's newsletter and get his political insight delivered right to your inbox!

43% of African-Americans Would Feel Threatened If Approached By Police Officer

If they were alone and approached by a police officer, 43% of African-American voters say they would feel threatened rather than safe. A Scott Rasmussen national survey found that 33% of African-Americans would feel safe and 24% are not sure.

These results are especially striking because a majority or plurality of every other measured demographic group would feel safe in that situation. Seventy-six percent (76%) of White voters would feel safe along with 53% of Hispanic voters.

Overall, among all voters, 67% would feel safe and 18% would feel threatened.

There was no gender gap, but a significant generation gap. Among senior citizens, 89% would feel safe and 3% would be threatened. Voters 18-24 were more evenly divided: 41% would feel safe, 39% threatened.

On a partisan basis, 81% of Republicans say they would feel safe in that situation. So would 59% of Democrats and 62% of Independents.

As on many issues, there is a significant gap between the views of White and Black Democrats. Seventy-two percent (72%) of White Democrats would feel safe while only 14% would be threatened. However, a plurality of Black Democrats (44%) would feel threatened. Just 37% would feel safe.

SIGN UP to receive Scott’s free email newsletter.

CHECK OUT Scott’s latest polls.

Note: Neither Scott Rasmussen, ScottRasmussen.com, nor RMG Research, Inc. have any affiliation with Rasmussen Reports. While Scott Rasmussen founded that firm, he left more than seven years ago and has had no involvement since that time.

Methodology

The survey of 1,200 Registered Voters was conducted by Scott Rasmussen using a mixed mode approach from February 18-20, 2021. Field work for the survey was conducted by RMG Research, Inc. Most respondents were contacted online or via text while 212 were contacted using automated phone polling techniques. Online respondents were selected from a list of Registered Voters and through a process of Random Digital Engagement. Certain quotas were applied, and the sample was lightly weighted by geography, gender, age, race, education, and political party to reasonably reflect the nation’s population of Registered Voters. Other variables were reviewed to ensure that the final sample is representative of that population.
Posted in Poll Results | Tagged

Scott's Newsletter
Sign up for Scott's newsletter and get his political insight delivered right to your inbox!

10% Know Someone Who Was Injured or Lost Property in Recent Riots

Ten percent (10%) of voters have close friends or relatives who were injured or had their property destroyed in recent riots. A Scott Rasmussen national survey found that 85% do not and 5% are not sure.

Among voters under 35, 19% know someone who has been hurt by the riots. Among older voters (55+), just 4% say the same.

The survey also found that 45% of voters are worried are violent protests and riots will come to their community.

That total includes 54% of Republicans, 42% of Independent voters, and 39% of Democrats.

LISTEN TO Scott’s Podcast.

SIGN UP to receive Scott’s free email newsletter.

CHECK OUT Scott’s latest polls.

Note: Neither Scott Rasmussen, ScottRasmussen.com, nor RMG Research, Inc. have any affiliation with Rasmussen Reports. While Scott Rasmussen founded that firm, he left more than seven years ago and has had no involvement since that time.

Methodology

The survey of 1,200 Registered Voters was conducted by Scott Rasmussen using a mixed mode approach from September 24-26, 2020. Field work for the survey was conducted by RMG Research, Inc. Most respondents were contacted online or via text while 159 were contacted using automated phone polling techniques. Certain quotas were applied to the overall sample and lightly weighted by geography, gender, age, race, education, and political party to reasonably reflect the nation’s population of Registered Voters. Other variables were reviewed to ensure that the final sample is representative of that population.

Posted in Poll Results | Tagged ,

Scott's Newsletter
Sign up for Scott's newsletter and get his political insight delivered right to your inbox!

53% Disagree With Grand Jury Ruling in Breonna Taylor Case

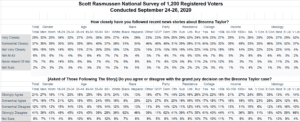
Most voters (53%) following the news about Breonna Taylor case disagree with the grand jury decision announced last week. A Scott Rasmussen national survey found that 38% agree with the decision and 9% are not sure.

Those totals include 21% who Strongly Agree with the decision and 41% who Strongly Disagree.

Seventy-two percent (72%) of Black voters disagree as do 59% of Hispanic voters. However, White Voters are more evenly divided.

The survey also found that two-thirds of voters (66%) were following the news at least somewhat closely. That includes 29% following the story Very Closely.

LISTEN TO Scott’s Podcast.

SIGN UP to receive Scott’s free email newsletter.

CHECK OUT Scott’s latest polls.

Note: Neither Scott Rasmussen, ScottRasmussen.com, nor RMG Research, Inc. have any affiliation with Rasmussen Reports. While Scott Rasmussen founded that firm, he left more than seven years ago and has had no involvement since that time.

Methodology

The survey of 1,200 Registered Voters was conducted by Scott Rasmussen using a mixed mode approach from September 24-26, 2020. Field work for the survey was conducted by RMG Research, Inc. Most respondents were contacted online or via text while 159 were contacted using automated phone polling techniques. Certain quotas were applied to the overall sample and lightly weighted by geography, gender, age, race, education, and political party to reasonably reflect the nation’s population of Registered Voters. Other variables were reviewed to ensure that the final sample is representative of that population.

Posted in Poll Results | Tagged

Scott's Newsletter
Sign up for Scott's newsletter and get his political insight delivered right to your inbox!

41% Prefer Candidate Supporting Black Lives Matter, 40% Prefer Blue Lives Matter

Given a choice between two candidates, 41% of voters prefer a candidate who supports  Black Lives Matter. A Scott Rasmussen national survey found that 40% prefer a candidate who supports Blue Lives Matter. Nineteen percent (19%) are not sure.

Eighty-six percent (86%) of Black voters favor the Black Lives Matter candidate. By a 53% to 29% margin, so do Hispanic voters. However, White voters, by a 47% to 32% margin, take the opposite view and prefer a Blue Lives Matter candidate.

Most voters with a college degree prefer Black Lives Matter. Those without a degree, favor Blue Lives Matter by a 45% to 34% margin.

Men lean a bit in favor of Blue Lives Matter while women take the opposite view.

Suburban voters are evenly divided.


LISTEN TO Scott’s Podcast.

SIGN UP to receive Scott’s free email newsletter.

CHECK OUT Scott’s latest polls.

Methodology

The survey of 1,200 Registered Voters was conducted by Scott Rasmussen using a mixed mode approach from September 3-5, 2020. Field work for the survey was conducted by RMG Research, Inc. Most respondents were contacted online or via text while 186 were contacted using automated phone polling techniques. Certain quotas were applied to the overall sample and lightly weighted by geography, gender, age, race, education, and political party to reasonably reflect the nation’s population of Registered Voters. Other variables were reviewed to ensure that the final sample is representative of that population.
Posted in Poll Results | Tagged

Scott's Newsletter
Sign up for Scott's newsletter and get his political insight delivered right to your inbox!

68% Have Had Protests In Their Area; Overwhelmingly Peaceful

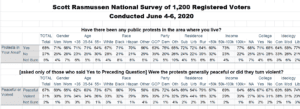
Sixty-eight percent (68%) of voters have recently had protests in their area. A Scott Rasmussen national survey found that 27% have not and 5% are not sure.

Among those who have had protests in their area, 67% say they have generally remained peaceful. Just 31% say they have turned violent.

Seventy-two percent (72%) of urban and suburban voters have had protests near where they live. Just 54% of rural voters say the same.

In those rural areas, 79% report that the protests have remained peaceful. Sixty-nine percent (69%) of those in the suburbs agree.

However, in urban areas, the responses are more mixed. While 54% of urban voters report that the protests in their area have remained peaceful, nearly as many (44%) say they have turned violent.

Scott Rasmussen’s Number of the Day is published each weekday morning by Ballotpedia. Starting today, Scott is releasing a daily PODCAST in partnership with Just The News.

SIGN UP to receive Scott’s free email newsletter.

CHECK OUT Scott’s latest polls.

Methodology

The survey of 1,200 Registered Voters was conducted by Scott Rasmussen using a mixed mode approach from June 4-6, 2020. Field work for the survey was conducted by RMG Research, Inc. Most respondents were contacted online or via text while 246 were contacted using automated phone polling techniques. Certain quotas were applied, and the overall sample was lightly weighted by geography, gender, age, race, education, and political party to reasonably reflect the nation’s population of Registered Voters. Other variables were reviewed to ensure that the final sample is representative of that population.


Posted in Poll Results | Tagged ,

Scott's Newsletter
Sign up for Scott's newsletter and get his political insight delivered right to your inbox!