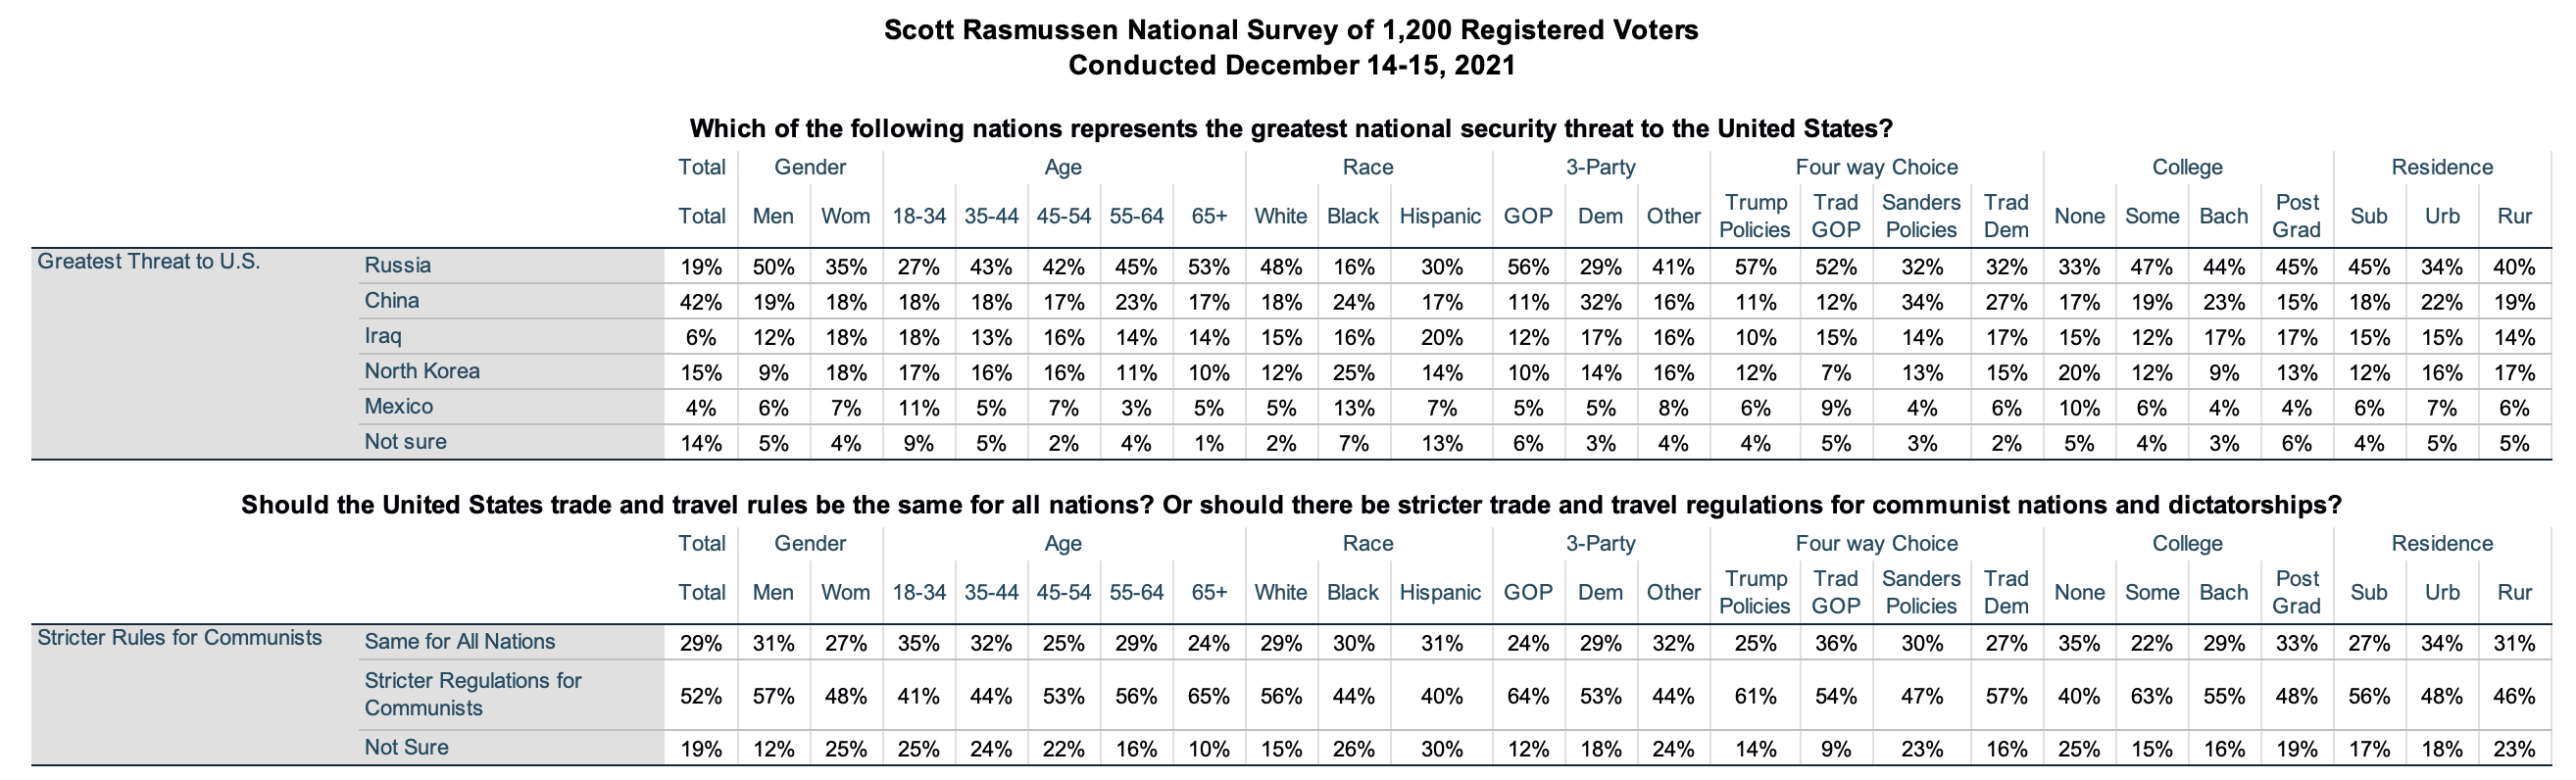
Fifty-two percent (52%) of voters believe the United States should impose stricter trade and travel regulations on communist nations and dictatorships. A Scott Rasmussen national survey disagree and believe the trade and travel rules be the same for all nations. Nineteen percent (19%) are not sure.
White voters and suburban voters are more likely to favor stricter regulations on communist nations and dictatorships. Older voters are more likely than younger voters to support stricter regulations.
The survey also found that 42% of voters see China as our nation’s greatest national security threat. Nineteen percent (19%) see Russia as the biggest threat while 15% name North Korea.
Most Republicans and a solid plurality of Independent voters see China as the biggest threat. Democrats are evenly divided between China and Russia.
SIGN UP to receive Scott’s free email newsletter.
CHECK OUT Scott’s latest polls.
Note: Neither Scott Rasmussen, ScottRasmussen.com, nor RMG Research, Inc. have any affiliation with Rasmussen Reports. While Scott Rasmussen founded that firm, he left more than seven years ago and has had no involvement since that time.
Question 1:
Which of the following nations represents the greatest national security threat to the United States?
19% Russia
42% China
6% Iraq
15% North Korea
4% Mexico
14% Not sure
Question 2:
Should the United States trade and travel rules be the same for all nations? Or should there be stricter trade and travel regulations for communist nations and dictatorships?
29% The same for all nations
52% Stricter regulations for communist nations and dictatorships
19% Not sure
Methodology
The survey of 1,200 Registered Voters was conducted online by Scott Rasmussen on December 14-15, 2021. Field work for the survey was conducted by RMG Research, Inc. Certain quotas were applied, and the sample was lightly weighted by geography, gender, age, race, education, internet usage, and political party to reasonably reflect the nation’s population of Registered Voters. Other variables were reviewed to ensure that the final sample is representative of that population.