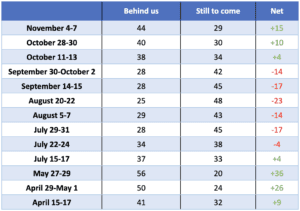
Forty-six percent (46%) of voters now believe the worst of the pandemic is behind us. That’s up six points since the end of October and up 18 points since the end of September. A Scott Rasmussen national survey found that 28% believe the worst is still to come and 26% are not sure.
This is the most optimistic assessment since May.
Looking back, confidence about the pandemic grew dramatically early in the area as the vaccines became available. By May, 56% of voters said the worst was behind us.
However, with the arrival of the Delta variant, confidence collapsed. By late August, just 25% believed the worst was behind us. At that point, nearly twice as many (48%) believed the worst was still to come.
Then, when October arrived, confidence once again began to grow dramatically. By the end of October, 75% of voters were close to resuming their normal life in terms of going out socially, traveling, and interacting with others in person.
Among those who don’t believe the worst is behind us, only half (51%) are worried about ongoing health issues. Thirty-six percent (36%) are worried about more government restrictions and mandates. This suggests that government efforts to combat the virus through further restrictions are likely to antagonize many voters.
SIGN UP to receive Scott’s free email newsletter.
CHECK OUT Scott’s latest polls.
Note: Neither Scott Rasmussen, ScottRasmussen.com, nor RMG Research, Inc. have any affiliation with Rasmussen Reports. While Scott Rasmussen founded that firm, he left more than seven years ago and has had no involvement since that time.
Question 1:
Is the worst of the pandemic behind us, or is it still to come?
46% Behind us
28% Still to come
26% Not sure
Question 2:
Did the Chinese government make the global pandemic worse by withholding important research and releasing false information?
68% Yes
10% No
21% Not sure
Methodology
The survey of 1,200 Registered Voters was conducted online by Scott Rasmussen on November 8-11, 2021. Field work for the survey was conducted by RMG Research, Inc. Certain quotas were applied, and the sample was lightly weighted by geography, gender, age, race, education, internet usage, and political party to reasonably reflect the nation’s population of Registered Voters. Other variables were reviewed to ensure that the final sample is representative of that population.


