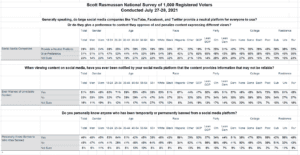
Just 29% of voters believe large social media companies like YouTube, Facebook, and Twitter provide a neutral platform for everyone to use. A Scott Rasmussen national survey found that 51% believe they give a preference to content they approve of and penalize content expressing different views. Twenty percent (20%) are not sure.
When viewing content on social media, 51% have been notified by their social media platform that the content provides information that may not be reliable. Thirty-three percent (33%) have not.
Nearly half of all voters (46%) say they personally know someone who has been temporarily or permanently banned from a social media platform. A nearly identical number–45%– do not.
Republicans, by a 66% to 19% margin, believe the social media companies give preference to content they like while Democrats are evenly divided on the question. Among Independent voters, just 25% believe social media companies provide a neutral platform while 48% take the opposite view.
Those with a postgraduate degree are evenly divided on the question. Most other voters believe the social media platforms penalize content expressing different views.
SIGN UP to receive Scott’s free email newsletter.
CHECK OUT Scott’s latest polls.
Note: Neither Scott Rasmussen, ScottRasmussen.com, nor RMG Research, Inc. have any affiliation with Rasmussen Reports. While Scott Rasmussen founded that firm, he left more than seven years ago and has had no involvement since that time.
Methodology
The survey of 1,000 Registered Voters was conducted by Scott Rasmussen using a mixed mode approach from July 27-28, 2021. Field work for the survey was conducted by RMG Research, Inc. Most respondents were contacted online or via text while 232 were contacted using automated phone polling techniques. Online respondents were selected from a list of Registered Voters and through a process of Random Digital Engagement. Certain quotas were applied, and the sample was lightly weighted by geography, gender, age, race, education, internet usage, and political party to reasonably reflect the nation’s population of Registered Voters. Other variables were reviewed to ensure that the final sample is representative of that population.