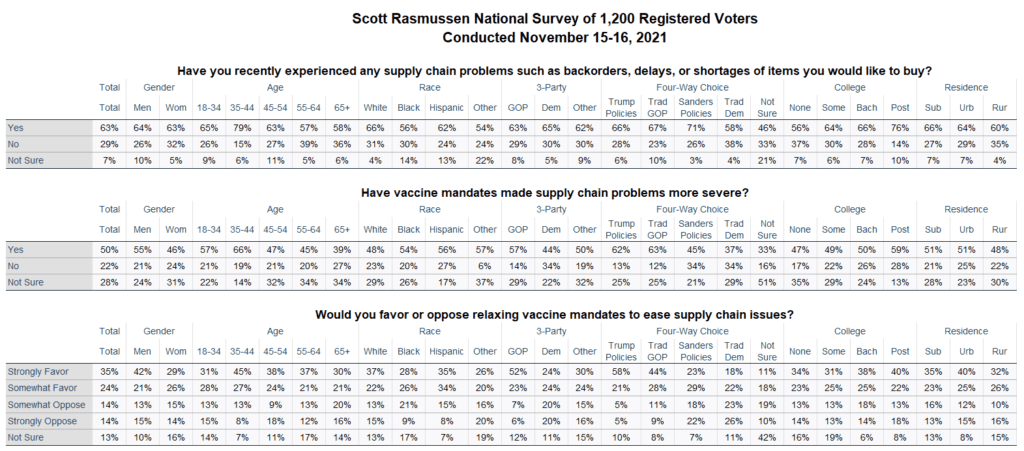
Fifty-nine percent (59%) of voters favor relaxing vaccine mandates to ease supply chain issues. A Scott Rasmussen national survey found that 28% are opposed to relaxing the mandates and 13% are not sure.
Those totals include 35% who Strongly Favor relaxing the mandates and 14% who are Strongly Opposed.
The survey found that 63% of voters have recently experienced supply chain issues such as backorders, delays, and shortages of items they would like to buy.
Fifty percent (50%) of voters believe vaccine mandates have made supply chain problems worse. Twenty-two percent (22%) disagree and 28% are not sure.
Seventy-five percent (75%) of Republicans favor relaxing the mandates. Independent voters by a 54% to 31% margin, agree. Democrats are more evenly divided– 48% favor relaxing the mandates and 40% are opposed.
As on many issues, there is a gap between the views of White Democrats and Black Democrats. By a 47% to 43% margin, White Democrats oppose relaxing the mandates. Black Democrats favor relaxing the mandates by a 51% to 32% margin. Hispanic and other Democrats favor relaxing the mandates by a 64% to 28% margin.
SIGN UP to receive Scott’s free email newsletter.
CHECK OUT Scott’s latest polls.
Note: Neither Scott Rasmussen, ScottRasmussen.com, nor RMG Research, Inc. have any affiliation with Rasmussen Reports. While Scott Rasmussen founded that firm, he left more than seven years ago and has had no involvement since that time.
Question 1:
Have you recently experienced any supply chain problems such as backorders, delays, or shortages of items you would like to buy?
63% Yes
29% No
7% Not sure
Question 2:
Have vaccine mandates made supply chain problems more severe?
50% Yes
22% No
28% Not sure
Question 3:
Would you favor or oppose relaxing vaccine mandates to ease supply chain issues?
35% Strongly favor
24% Somewhat favor
14% Somewhat oppose
14% Strongly oppose
13% Not sure
Methodology
The survey of 1,200 Registered Voters was conducted online by Scott Rasmussen on November 15-16, 2021. Field work for the survey was conducted by RMG Research, Inc. Certain quotas were applied, and the sample was lightly weighted by geography, gender, age, race, education, internet usage, and political party to reasonably reflect the nation’s population of Registered Voters. Other variables were reviewed to ensure that the final sample is representative of that population.


