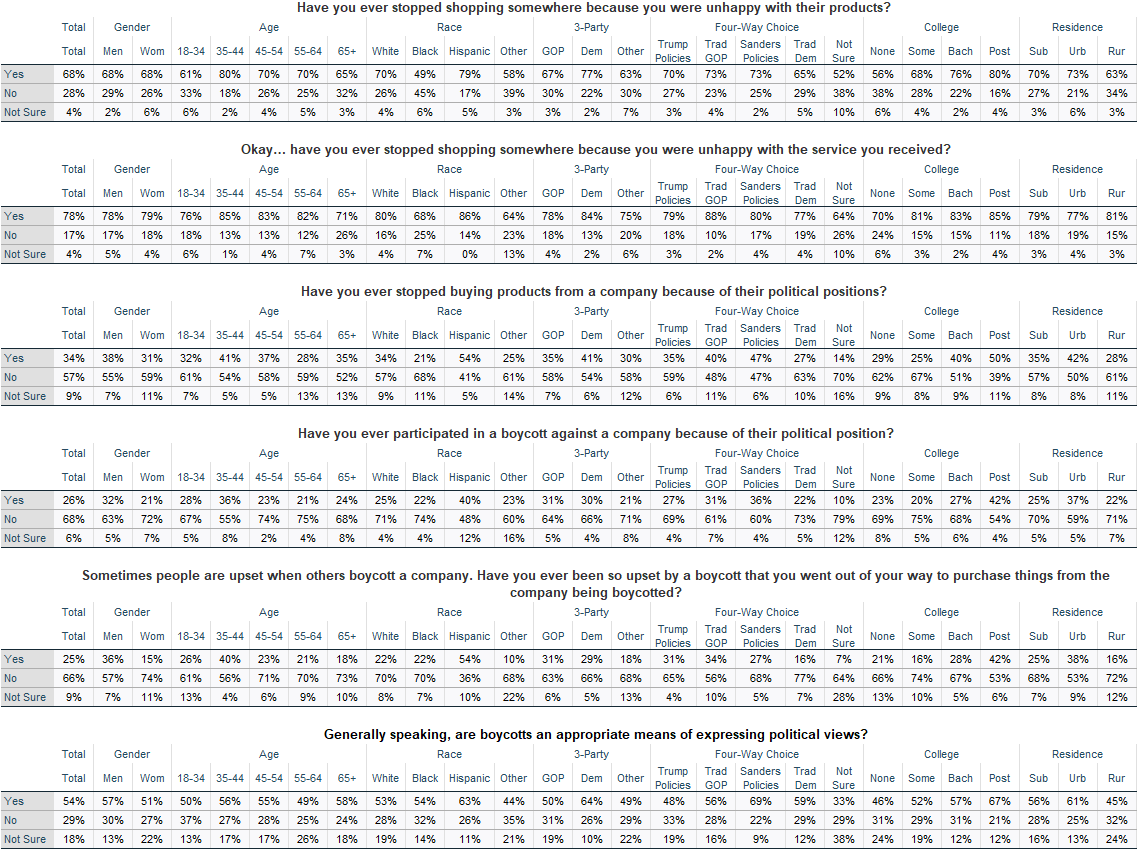
At some point in their life, 26% of voters have participated in a boycott against a company because of their political position. A Scott Rasmussen national survey found that far larger numbers have stopped shopping somewhere because they were unhappy with the company’s service (78%) or products (68%).
Twenty-five percent (25%) have at some point been so upset by a boycott that they went out of their way to purchase things from the company being boycotted.
SIGN UP to receive Scott’s free email newsletter.
CHECK OUT Scott’s latest polls.
Note: Neither Scott Rasmussen, ScottRasmussen.com, nor RMG Research, Inc. have any affiliation with Rasmussen Reports. While Scott Rasmussen founded that firm, he left more than seven years ago and has had no involvement since that time.
Question 1:
Have you ever stopped shopping somewhere because you were unhappy with their products?
68% Yes
28% No
4% Not sure
Question 2:
Okay… have you ever stopped shopping somewhere because you were unhappy with the service you received?
78% Yes
17% No
4% Not sure
Question 3:
Have you ever stopped buying products from a company because of their political positions?
34% Yes
57% No
9% Not sure
Question 4:
Have you ever participated in a boycott against a company because of their political position?
26% Yes
68% No
6% Not sure
Question 5:
Sometimes people are upset when others boycott a company. Have you ever been so upset by a boycott that you went out of your way to purchase things from the company being boycotted?
25% Yes
66% No
9% Not sure
Question 6:
Generally speaking, are boycotts an appropriate means of expressing political views?
54% Yes
29% No
18% Not sure
Methodology
The survey of 1,200 Registered Voters was conducted online by Scott Rasmussen on November 17-18, 2021. Field work for the survey was conducted by RMG Research, Inc. Certain quotas were applied, and the sample was lightly weighted by geography, gender, age, race, education, internet usage, and political party to reasonably reflect the nation’s population of Registered Voters. Other variables were reviewed to ensure that the final sample is representative of that population.