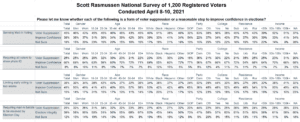
The Brennan Center and other activist organizations says that requiring voters to show photo ID is a form of voter suppression. However, just 25% of voters nationwide agree. Instead, 66% see photo ID requirements as a reasonable step to improve confidence in elections.
A majority of every measured demographic group hold the view that such requirements are reasonable. That includes 77% of Republicans, 67% of Independents, and 56% of Democrats.
Another election reform considered by some to be a form of voter suppression is requiring all ballots to be received by Election Day. However, only 29% of voters agree with that assessment. Twice as many–59%– see that as a reasonable step to improve confidence in elections.
Two other items defined by the Brennan Center as voter suppression draw more mixed responses.
- Banning mail-in voting is seen as suppression by 45% of all voters. Thirty-eight percent (38%) disagree. On that question, 63% of Democrats see it as suppression, 54% of Republicans see it as a reasonable step, and Independent voters are evenly divided.
- Limiting early voting to two weeks is seen as suppression by 35% and a reasonable step by 49%. Fifty-two percent (52%) of Democrats see such a timetable as voter suppression. Sixty-five percent (65%) of Republicans consider a reasonable step. By a 48% to 29% margin, Independents agree that it’s a reasonable step to increase confidence in elections.
SIGN UP to receive Scott’s free email newsletter.
CHECK OUT Scott’s latest polls.
Note: Neither Scott Rasmussen, ScottRasmussen.com, nor RMG Research, Inc. have any affiliation with Rasmussen Reports. While Scott Rasmussen founded that firm, he left more than seven years ago and has had no involvement since that time.
Methodology
The survey of 1,200 Registered Voters was conducted by Scott Rasmussen using a mixed mode approach from April 8-10, 2021. Field work for the survey was conducted by RMG Research, Inc. Most respondents were contacted online or via text while 217 were contacted using automated phone polling techniques. Online respondents were selected from a list of Registered Voters and through a process of Random Digital Engagement. Certain quotas were applied, and the sample was lightly weighted by geography, gender, age, race, education, and political party to reasonably reflect the nation’s population of Registered Voters. Other variables were reviewed to ensure that the final sample is representative of that population.