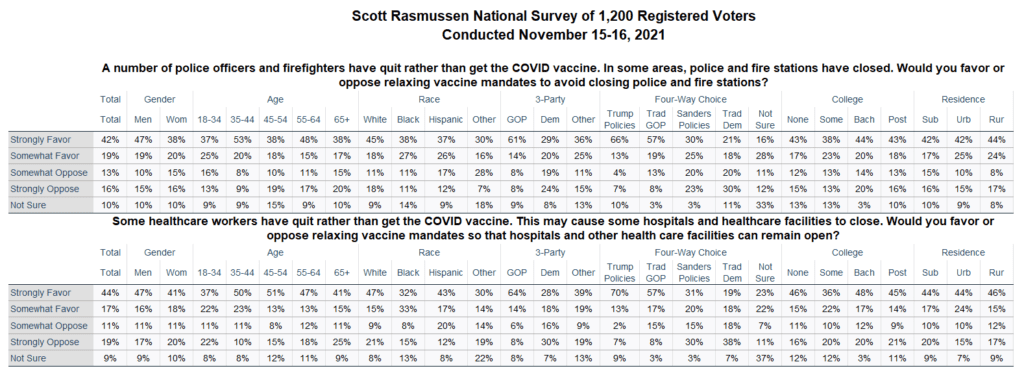
Sixty-one percent (61%) of voters favor relaxing vaccine mandates for police officers and fire fighters to avoid closing police and fire stations. A Scott Rasmussen national survey found that 29% are opposed.
By a 61% to 30% margin, voters also favor relaxing vaccine mandates for health care workers so that hospitals and other health care facilities can remain open.
Data released earlier showed that 59% favor relaxing mandates to ease supply chain problems.
These findings, along with other data, provide a sense that support for the mandates is soft. Forty-eight percent (48%) of voters now say they favor the mandates. That’s down six points over the past two months.
Seventy-five percent (75%) of voters are close to resuming normal life.
SIGN UP to receive Scott’s free email newsletter.
CHECK OUT Scott’s latest polls.
Note: Neither Scott Rasmussen, ScottRasmussen.com, nor RMG Research, Inc. have any affiliation with Rasmussen Reports. While Scott Rasmussen founded that firm, he left more than seven years ago and has had no involvement since that time.
Question 1:
A number of police officers and firefighters have quit rather than get the COVID vaccine. In some areas, police and fire stations have closed. Would you favor or oppose relaxing vaccine mandates to avoid closing police and fire stations?
42% Strongly favor
19% Somewhat favor
13% Somewhat oppose
16% Strongly oppose
10% Not sure
Question 2:
Some healthcare workers have quit rather than get the COVID vaccine. This may cause some hospitals and healthcare facilities to close. Would you favor or oppose relaxing vaccine mandates so that hospitals and other health care facilities can remain open?
44% Strongly favor
17% Somewhat favor
11% Somewhat favor
19% Strongly favor
9% Not sure
Methodology
The survey of 1,200 Registered Voters was conducted online by Scott Rasmussen on November 15-16, 2021. Field work for the survey was conducted by RMG Research, Inc. Certain quotas were applied, and the sample was lightly weighted by geography, gender, age, race, education, internet usage, and political party to reasonably reflect the nation’s population of Registered Voters. Other variables were reviewed to ensure that the final sample is representative of that population.


